Use Cases
Top N ListI want to identify which programs had the slowest response times during a specific period.
OWLens provides a Top N List dashboard that displays the programs (reports) with the longest response times in the SAP system during a selected time period. In addition to slowest-response reports, the screen also shows:
Reports that consumed the most CPU resources, Reports with the longest database query times
The Top N List screen offers various filtering options to help you focus on specific programs of interest, such as:Programs executed during a specific period (hour, day, week, month, quarter, year), All reports or limited to CBO programs, Dialog and other Task Type-specific programs
Response time is one of the most critical performance indicators in any SAP system. Reports with high CPU usage may require ABAP code tuning, While reports with long database response times may require SQL tuning review.
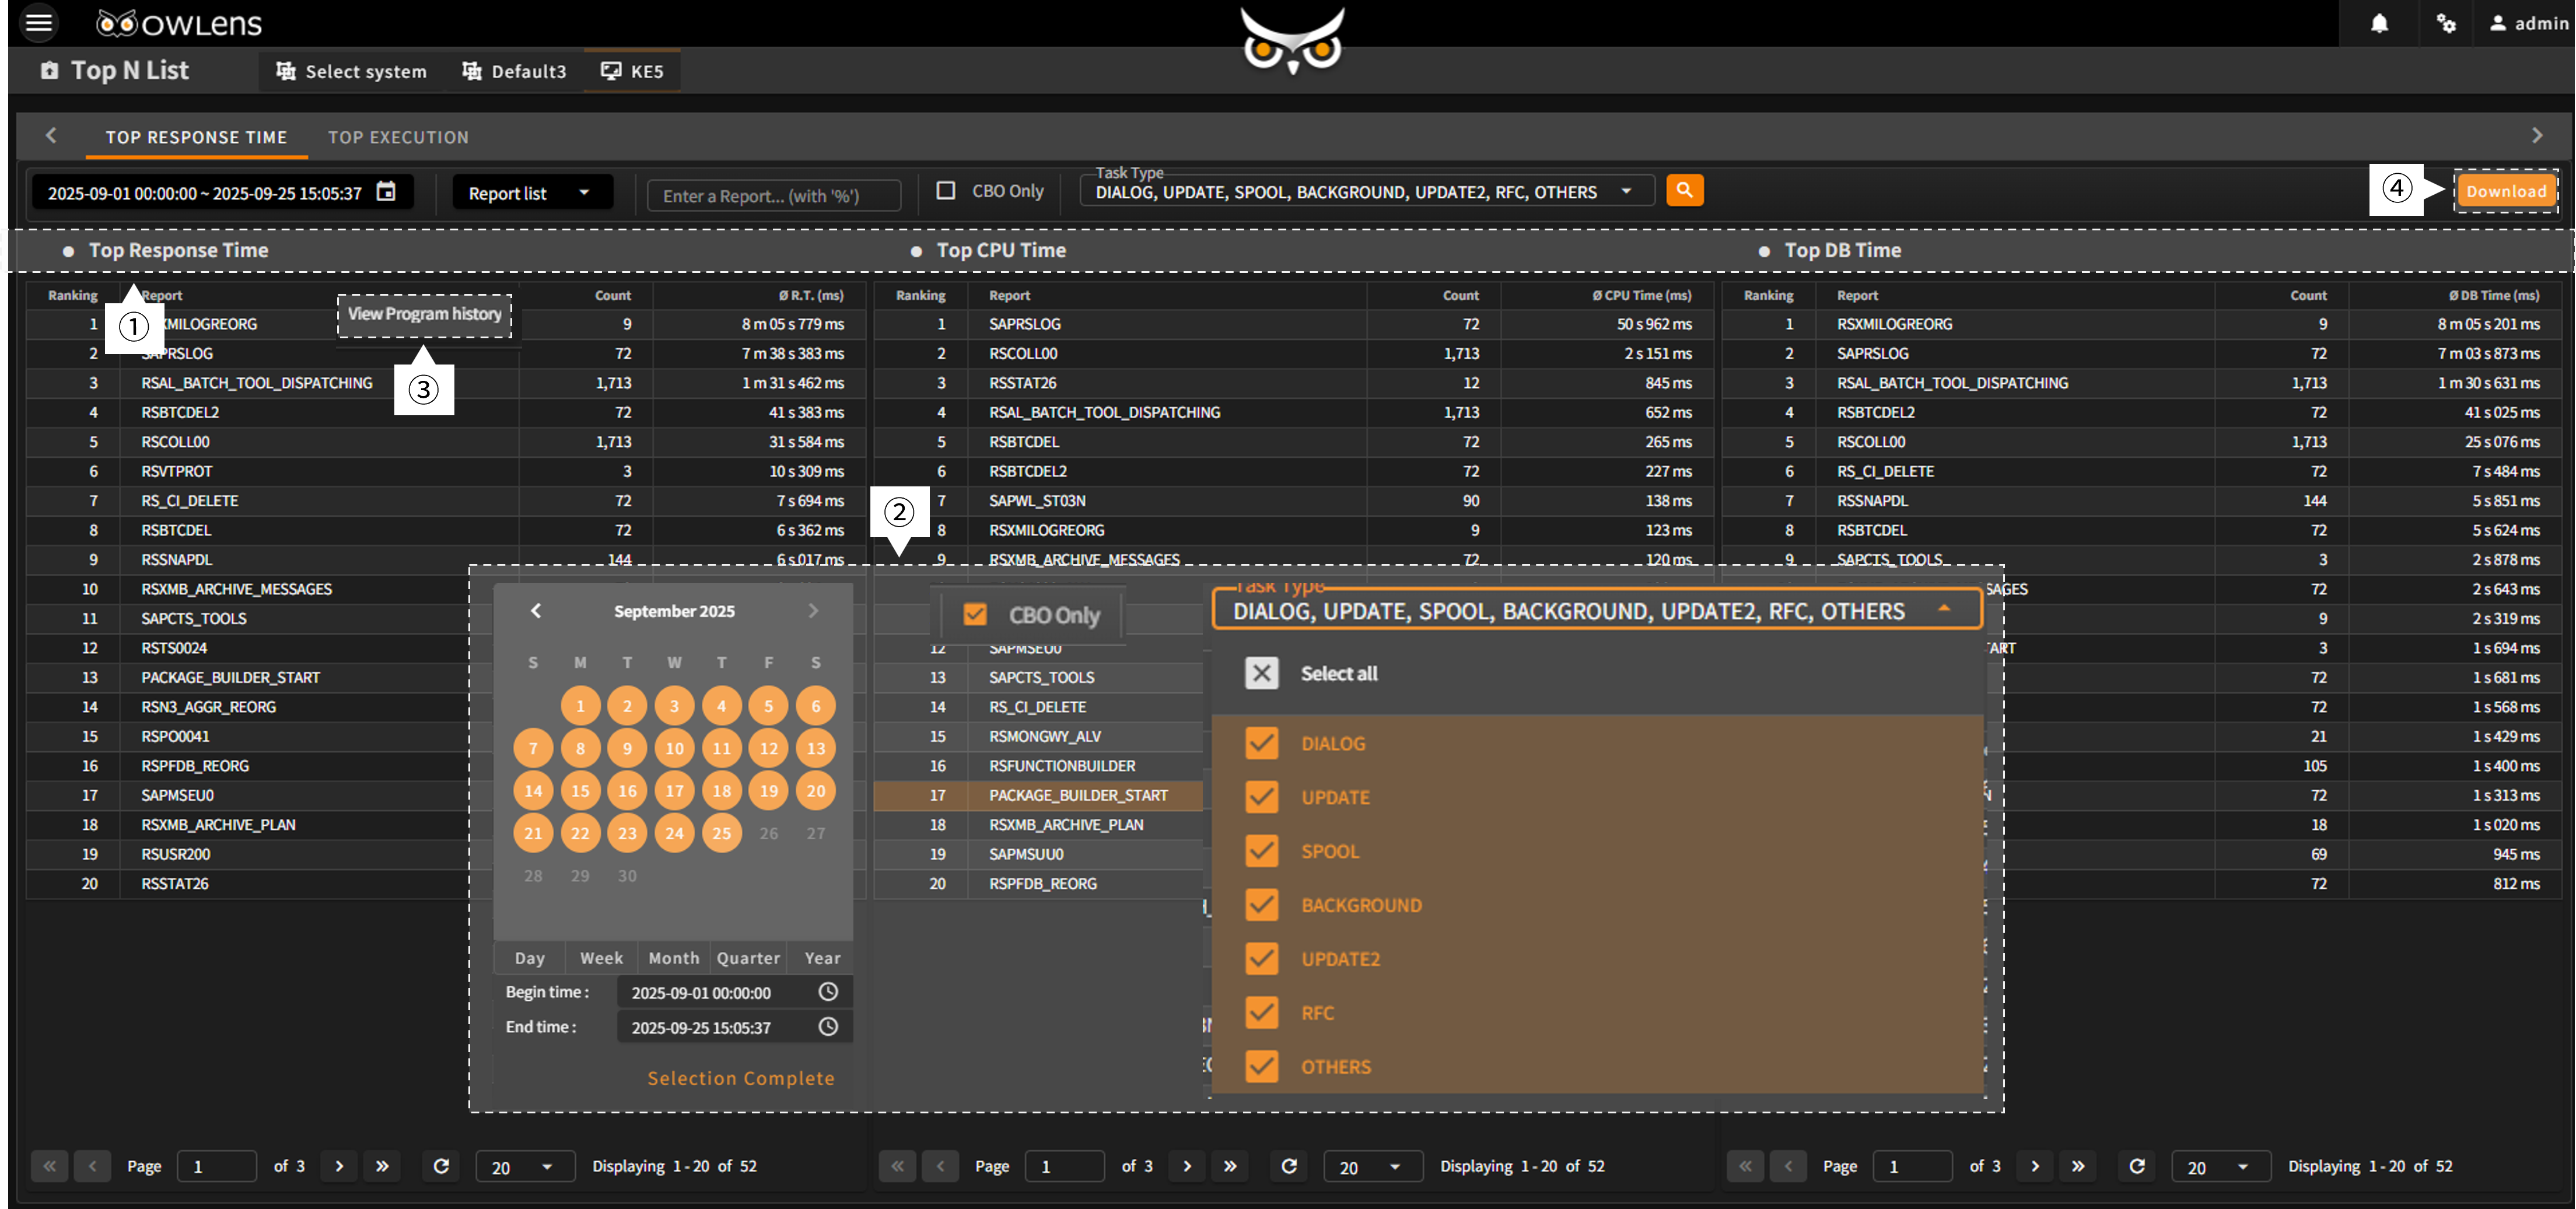
- Based on the entered search conditions, the Top N List displays:Top N programs with the longest response time, Top N programs with the highest CPU usage, Top N programs with the longest DB query time, These are presented in descending order.
- Use the filter panel below to narrow down the results by:Program execution period, CBO Only, Program Task Type.
- Right-click on a program in the list to access the “View Program History” option from the context menu, which opens the Program History screen for detailed execution records.
- Click the “Download” button to export the list to an Excel file for reporting or analysis.
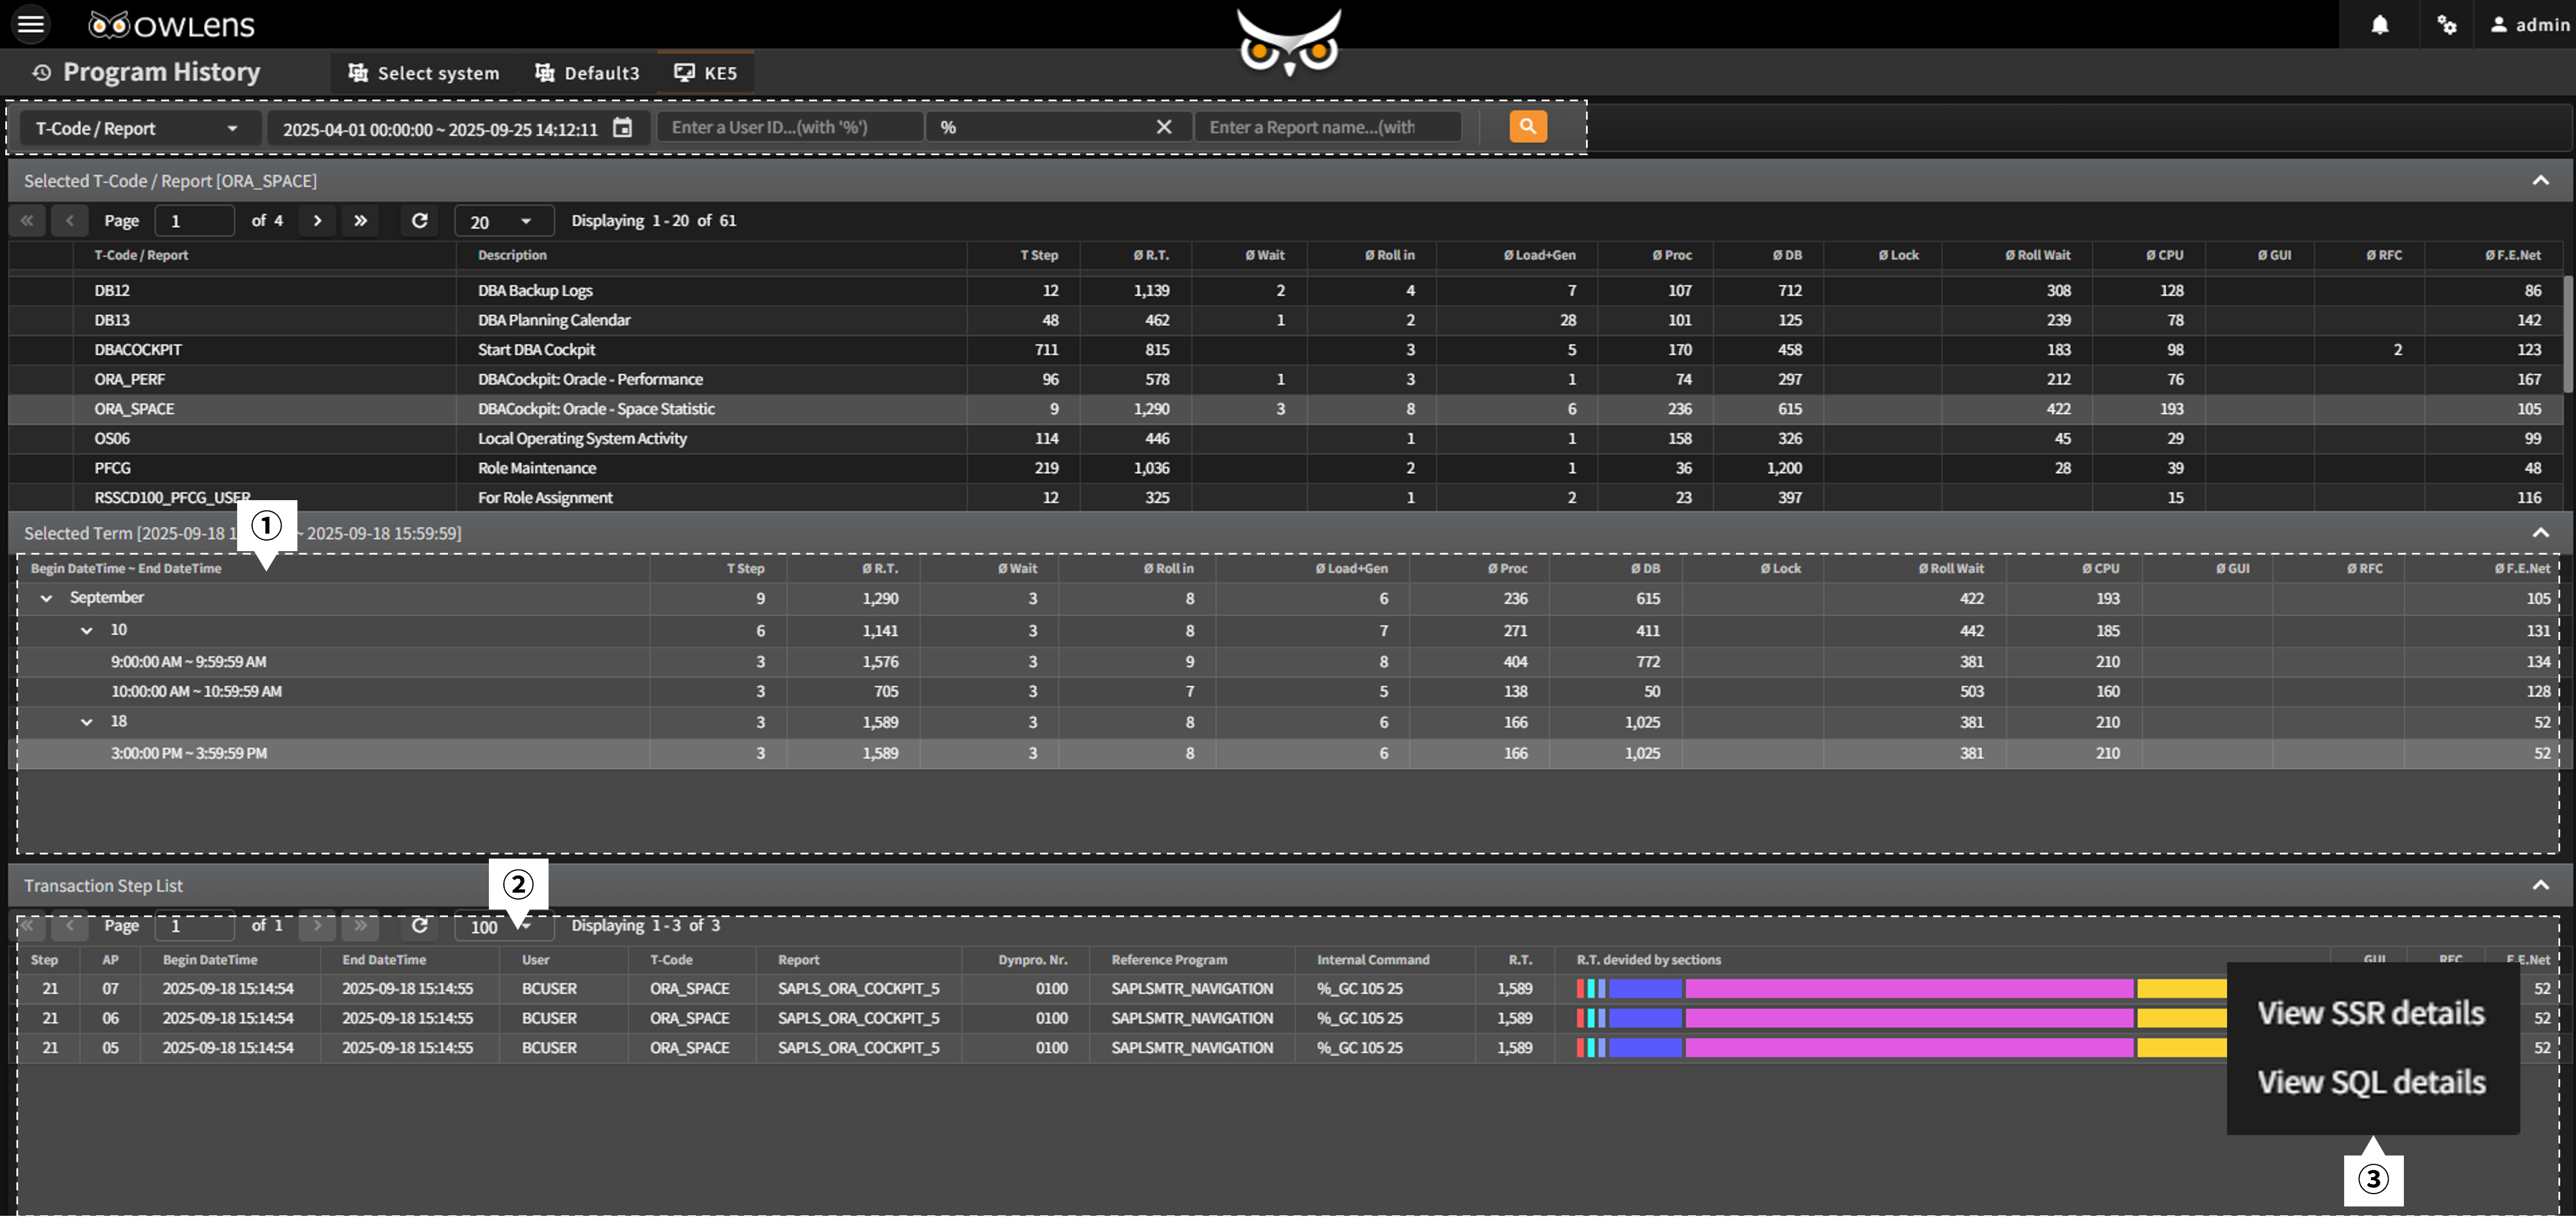
- On the Program History screen, execution records of the selected program during the specified period are shown in a tree structure (by month/day/hour), along with execution counts and section-level response time statistics.
- When clicking the final node (hour) in the tree, the system displays a chronological list of all executions during that hour, including who ran the program, from where, and what response was experienced.
- You can also right-click an individual execution entry to open “View SSR Details” or “View SQL Details” from the context menu, allowing deeper insight via the SSR Viewer and SQL Viewer
- Quickly identify programs that are causing system performance degradation.
- Assess whether CPU-intensive or DB-intensive programs require tuning.
- Perform detailed analysis of underperforming programs to rapidly understand system status and establish effective response strategies.