Use Cases
SSR Viewer & Context Analyzer(Root Cause Analysis)I need to investigate why a certain program took so long to execute.
OWLens provides an intuitive SSR Viewer feature that allows you to analyze the execution details of a specific program, including:
Which SAP internal transaction the program was part of, Execution time by section, Data volume sent/received, Memory usage, DBMS request information, RFC call context,
—all presented in a clear and structured UI similar to the way data is displayed in T-Code ST03N.
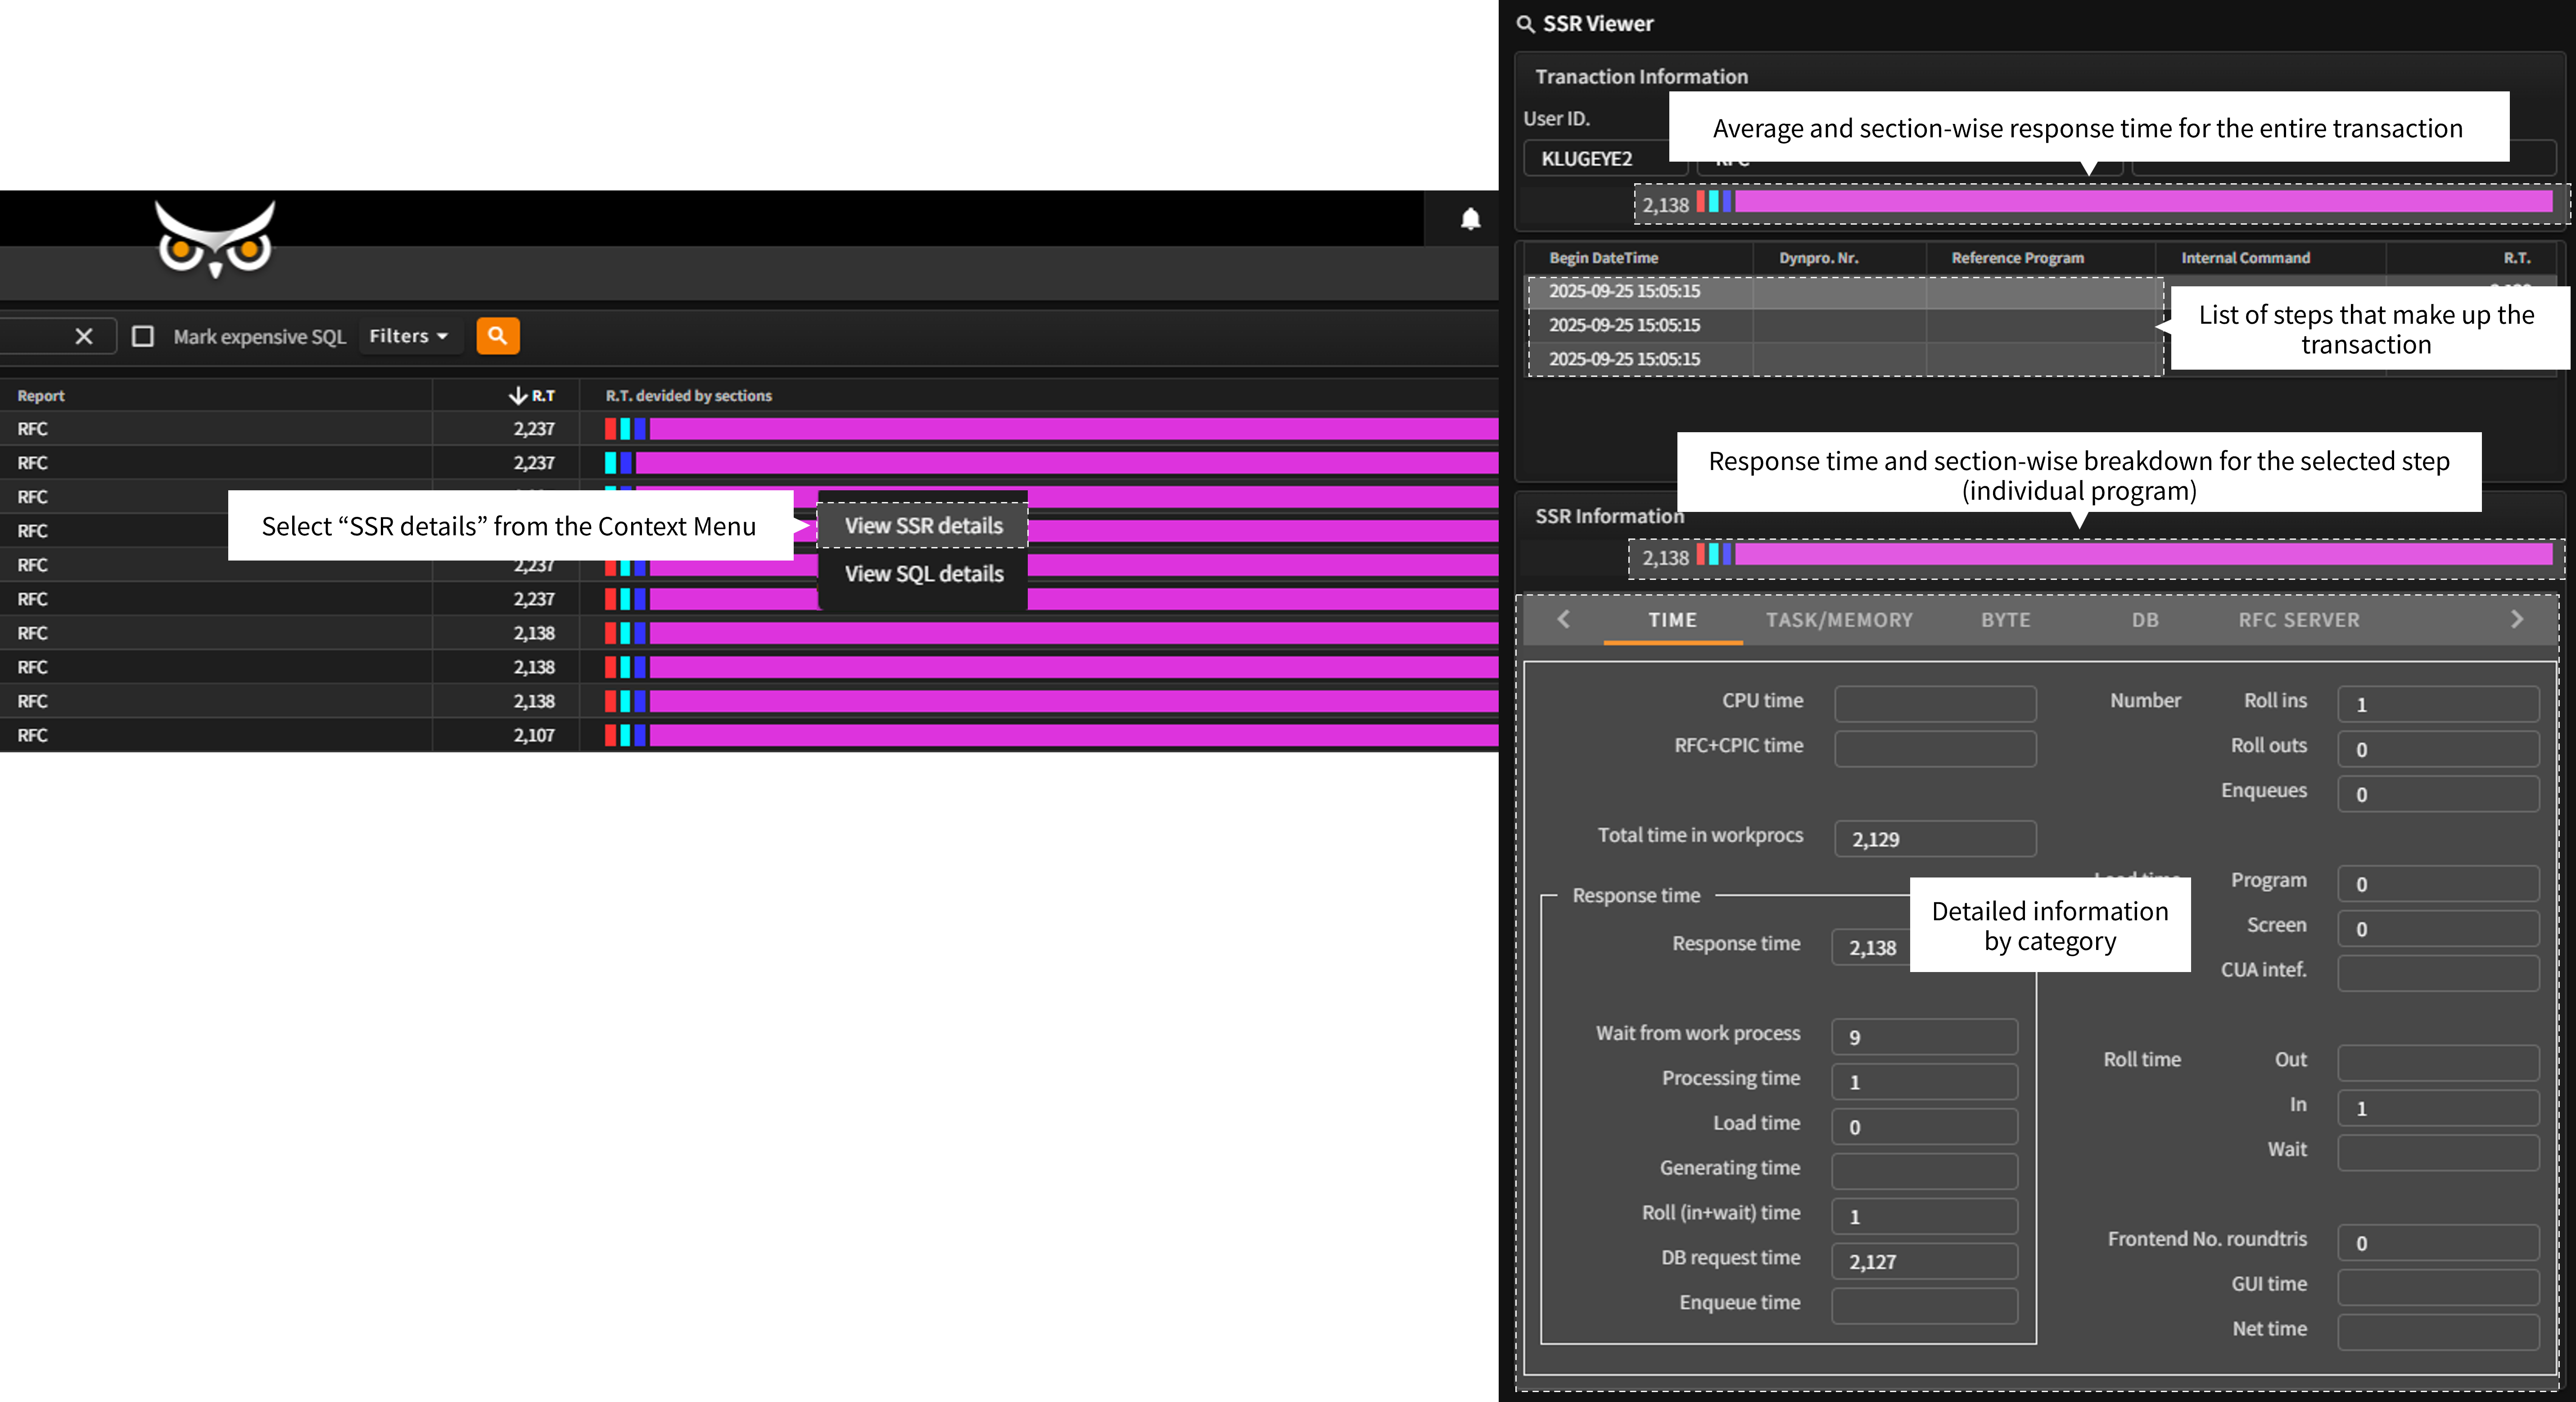
To access the SSR Viewer, simply select a program entry in the OWLView screen, right-click, and choose “View SSR Details” from the Context Menu.
This will open a detailed popup window with execution metrics and resource usage breakdowns.
(The same SSR Viewer can also be accessed directly from the Gantt chart in the Context Analyzer feature described below.)
- When you select “View SSR Details” from the Context Menu in the OWLView screen, the SSR Viewer window opens as a popup.
At the top of this screen, you can view a summary of the entire SAP transaction to which the selected program belongs. This includes:
The average response time of the overall transaction, Segment-level response time, A list of individual steps (each representing a program) that make up the transaction. - In the lower section, detailed execution metrics for the selected step (program) are displayed through a tabbed interface. These include:
Section-wise response time, Resource usage, DBMS request details, RFC call context, And other categorized performance data.
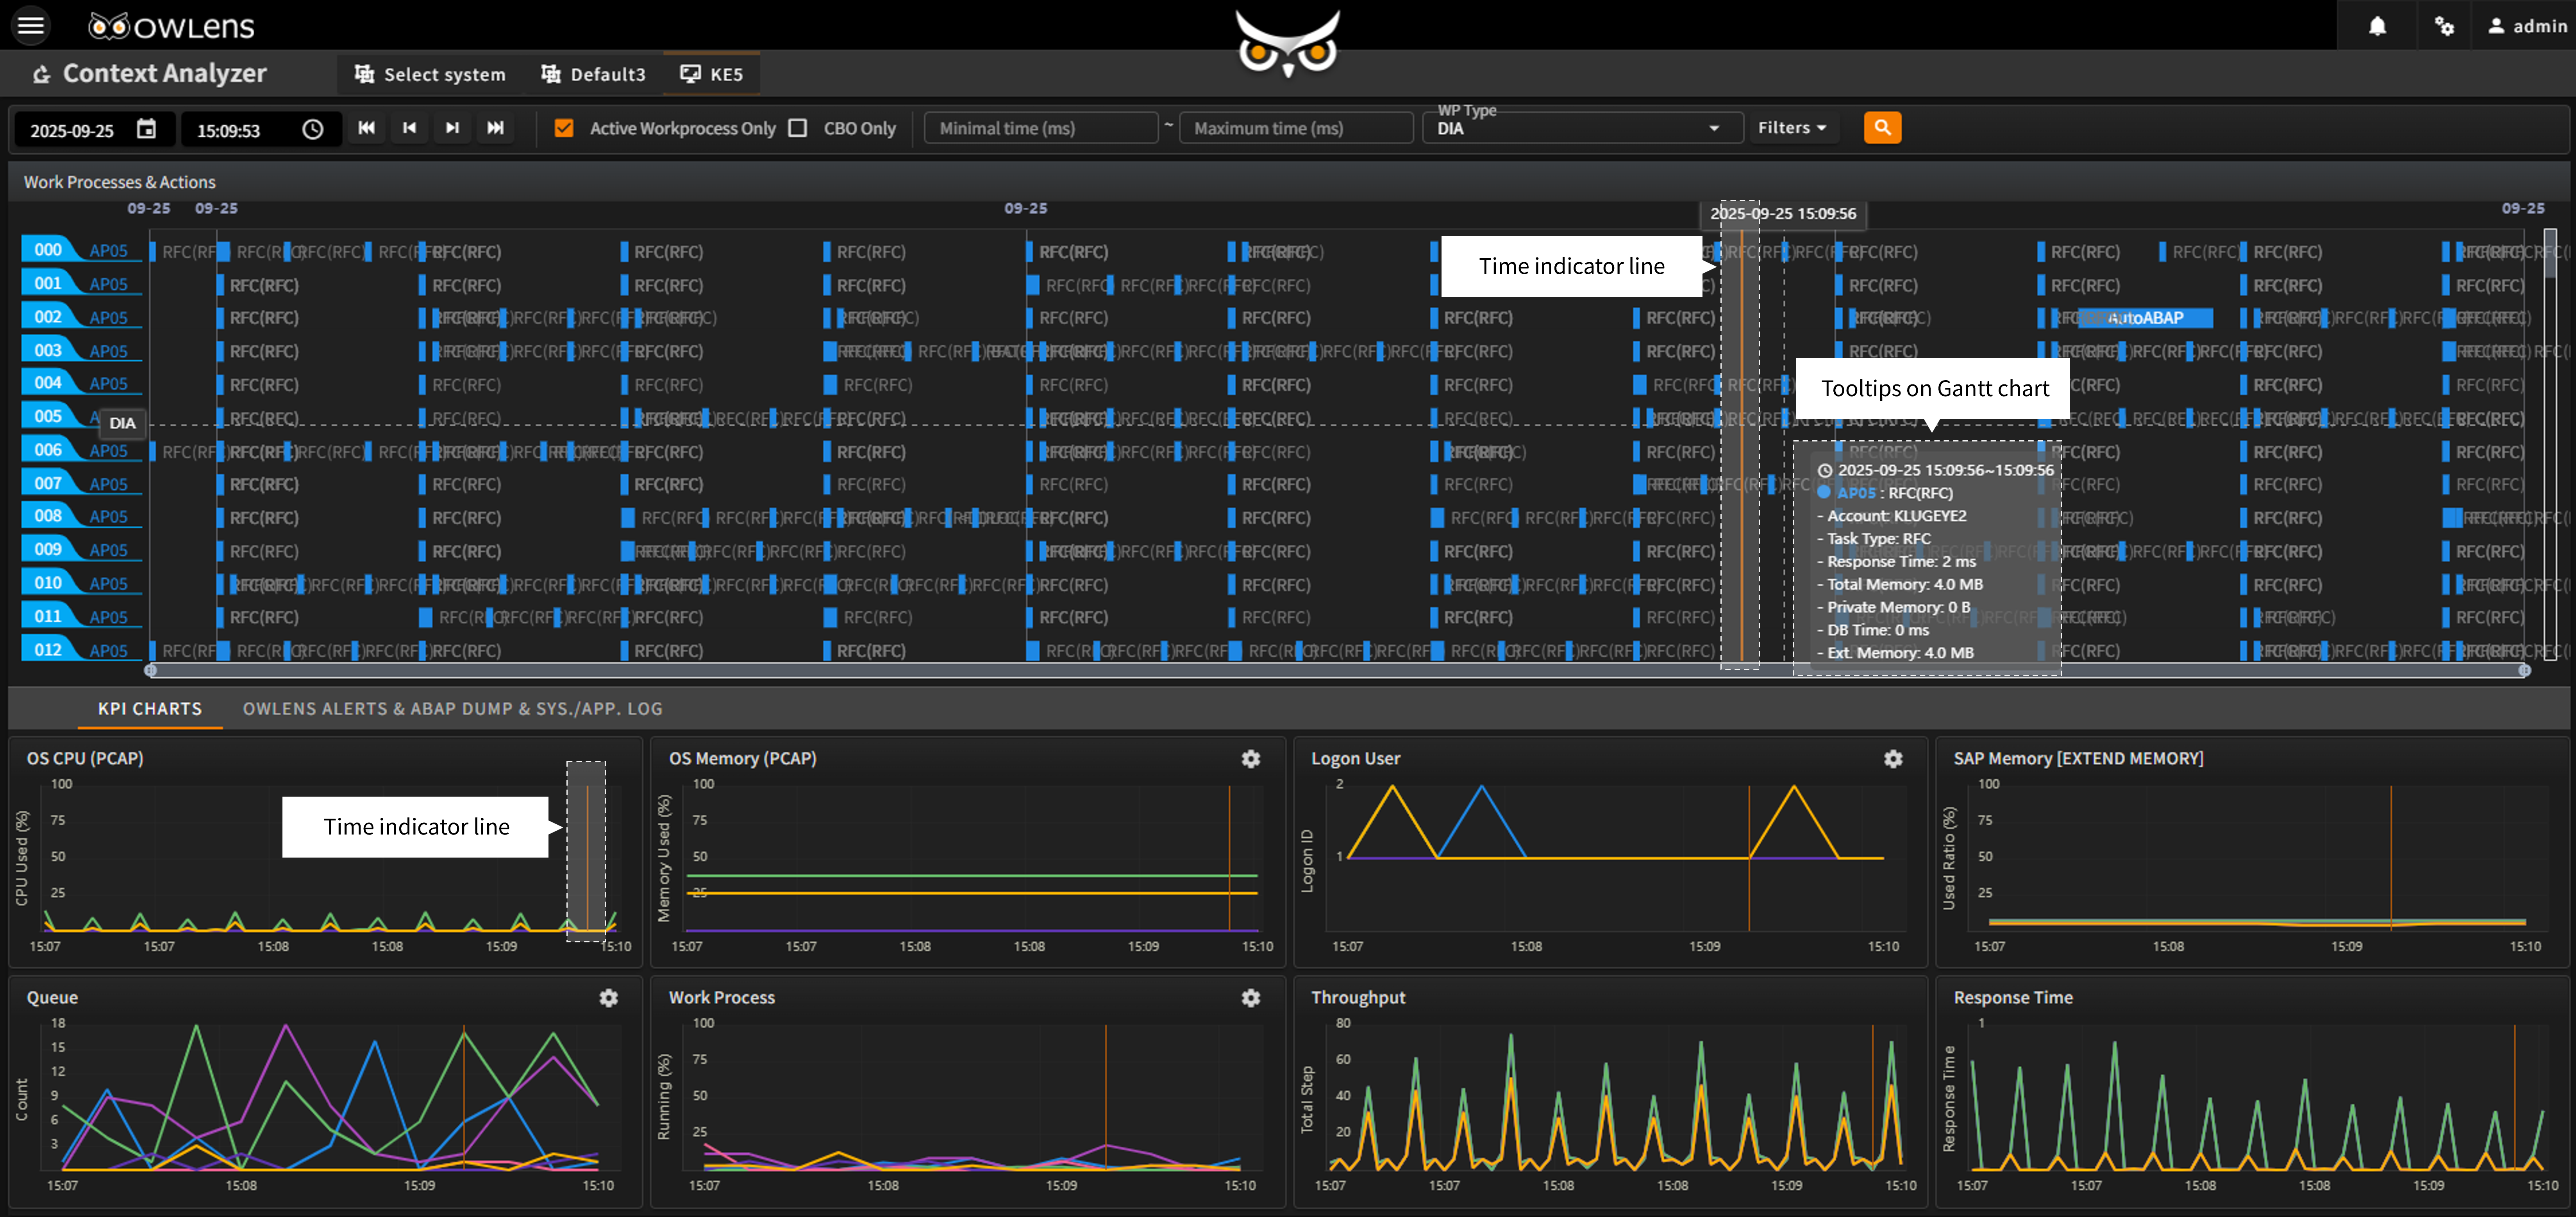
- In addition to the SSR Viewer, OWLens provides the Context Analyzer feature, which enables in-depth analysis of system behavior at the moment of a performance spike or alert. This tool allows users to thoroughly examine the system’s state from multiple angles and identify the root cause of an issue.
- The Context Analyzer displays all programs executed at the selected point in time as a Gantt chart, organized by instance and work process, with each program’s response time visualized and key execution information shown via tooltips on the chart.
- Below the Gantt chart, OWLens provides synchronized performance metrics, including:
OS resource usage, User session activity, Extended memory utilization, Dispatcher queue status, Work process load, System load and response time trends.
Each chart includes a time indicator that is synchronized with the Gantt chart’s timeline, allowing users to quickly understand the full system state at any moment of interest.
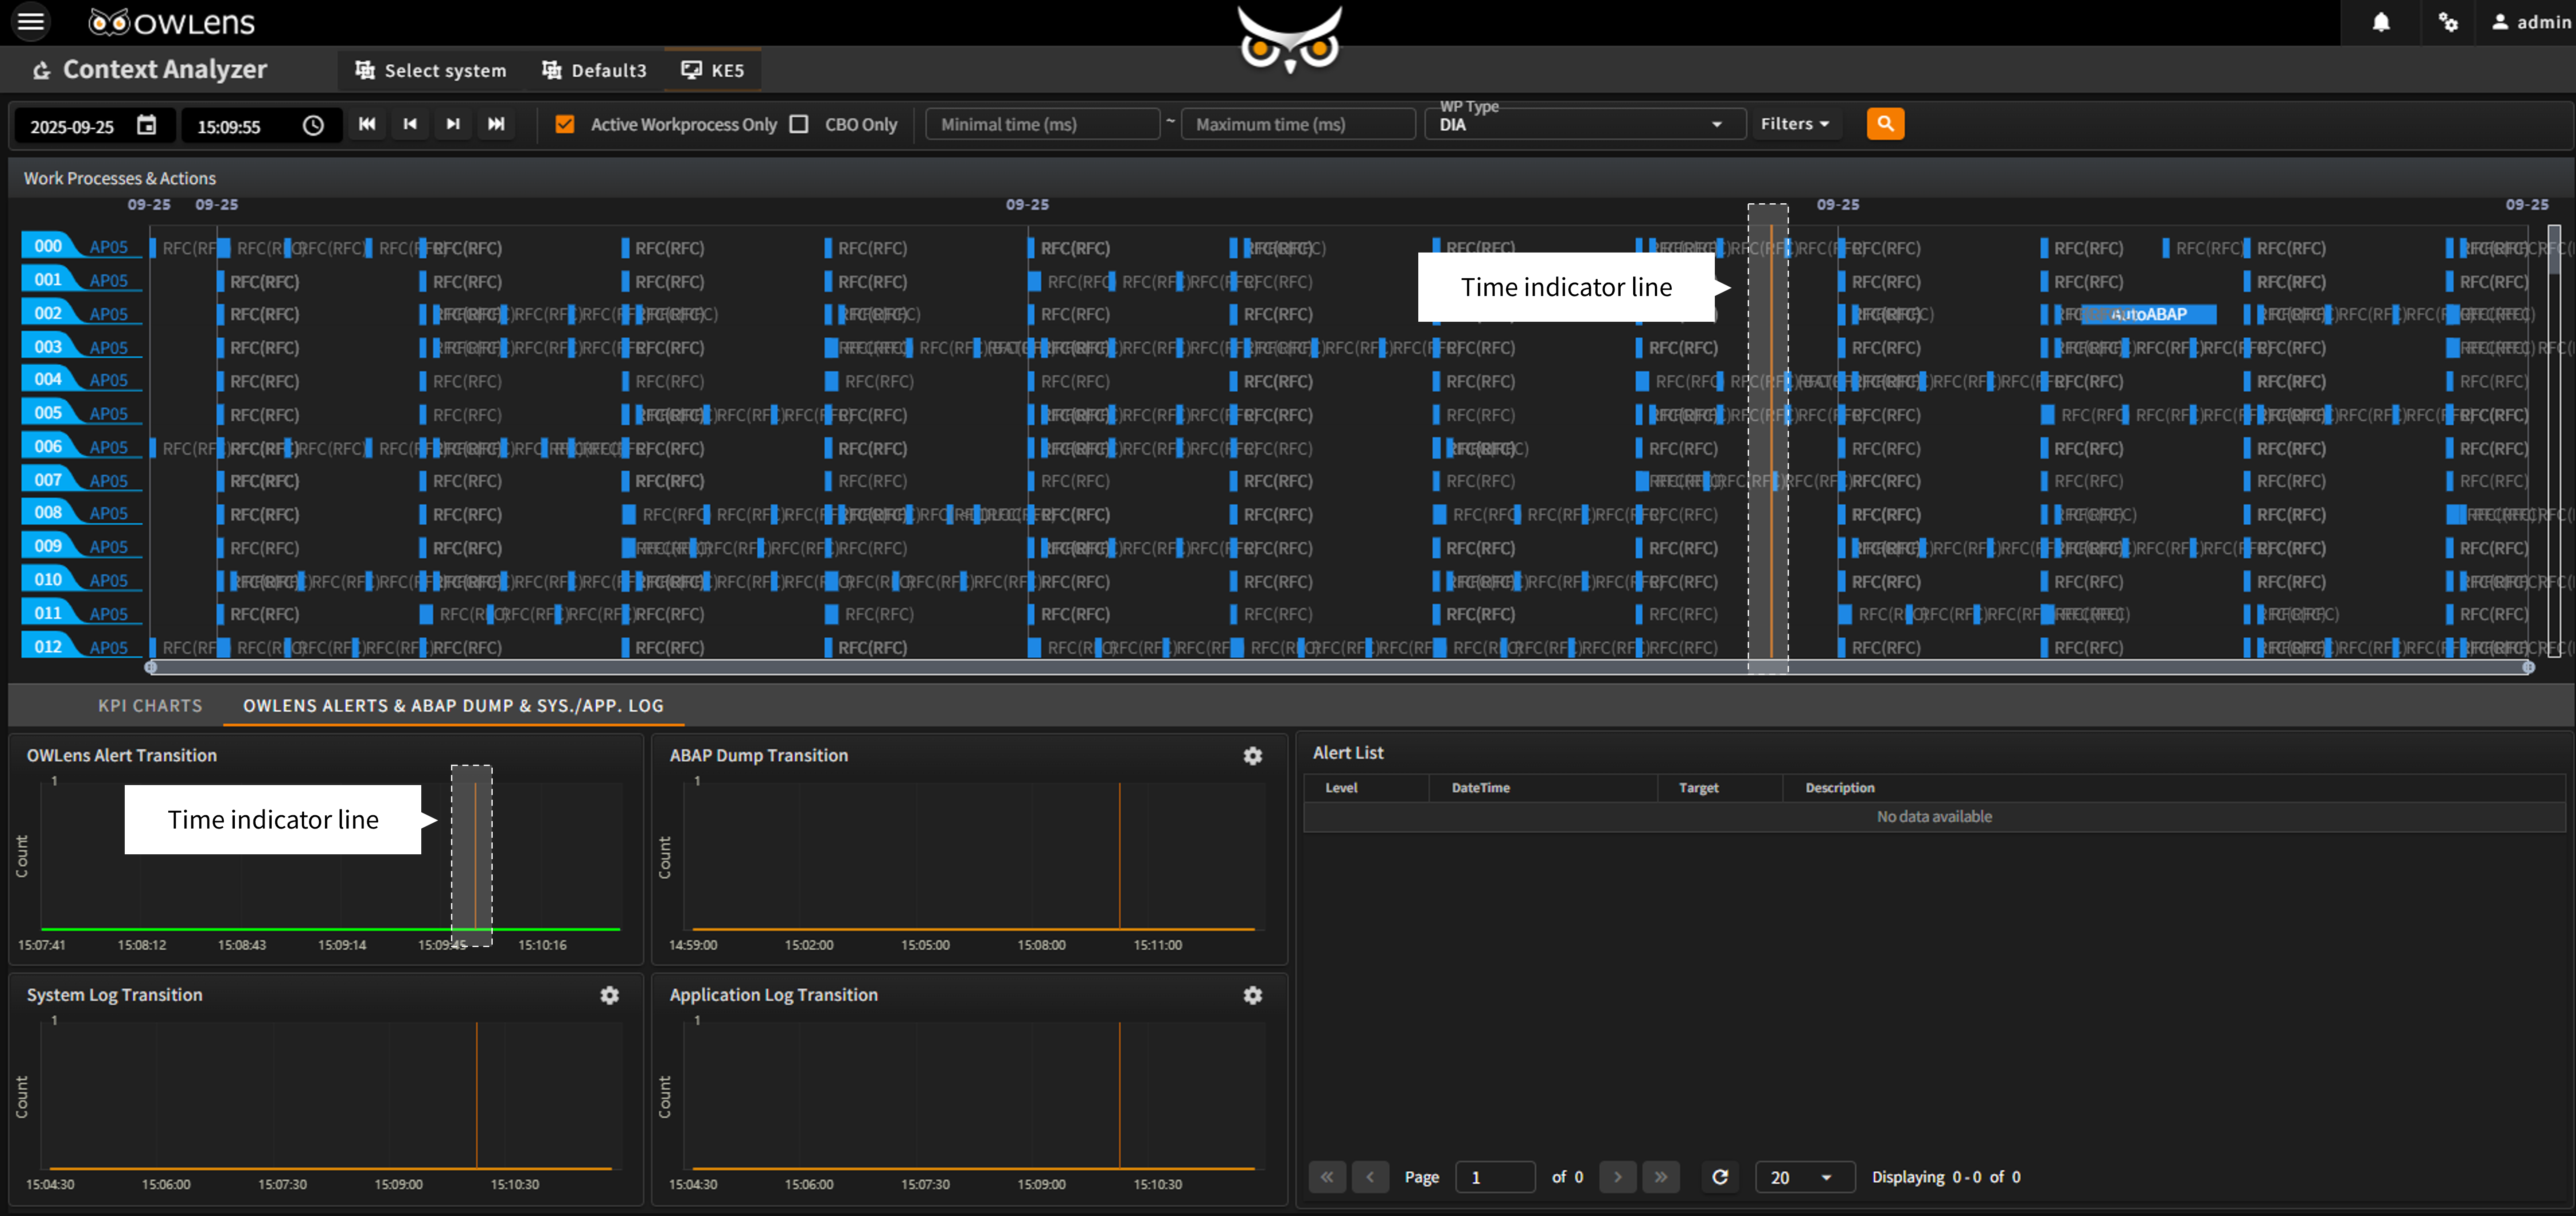
- The lower section features a tabbed interface that extends beyond the key performance metrics above, offering OWLens ALERT insights, along with SAP ABAP Dump, System Log, and Application Log charts and detailed records.
- These charts are always synchronized with the Gantt chart’s timeline indicator, making it easy to comprehensively view the overall system status at any selected point in time.
- Quickly pinpoint the root causes of system load or performance issues through multi-dimensional analysis.
- Analyze detailed system conditions at the exact time of a spike or alert to drive performance improvements.