Use Cases
SQL ViewerI want to check which SQL statements were executed in a long-running program.
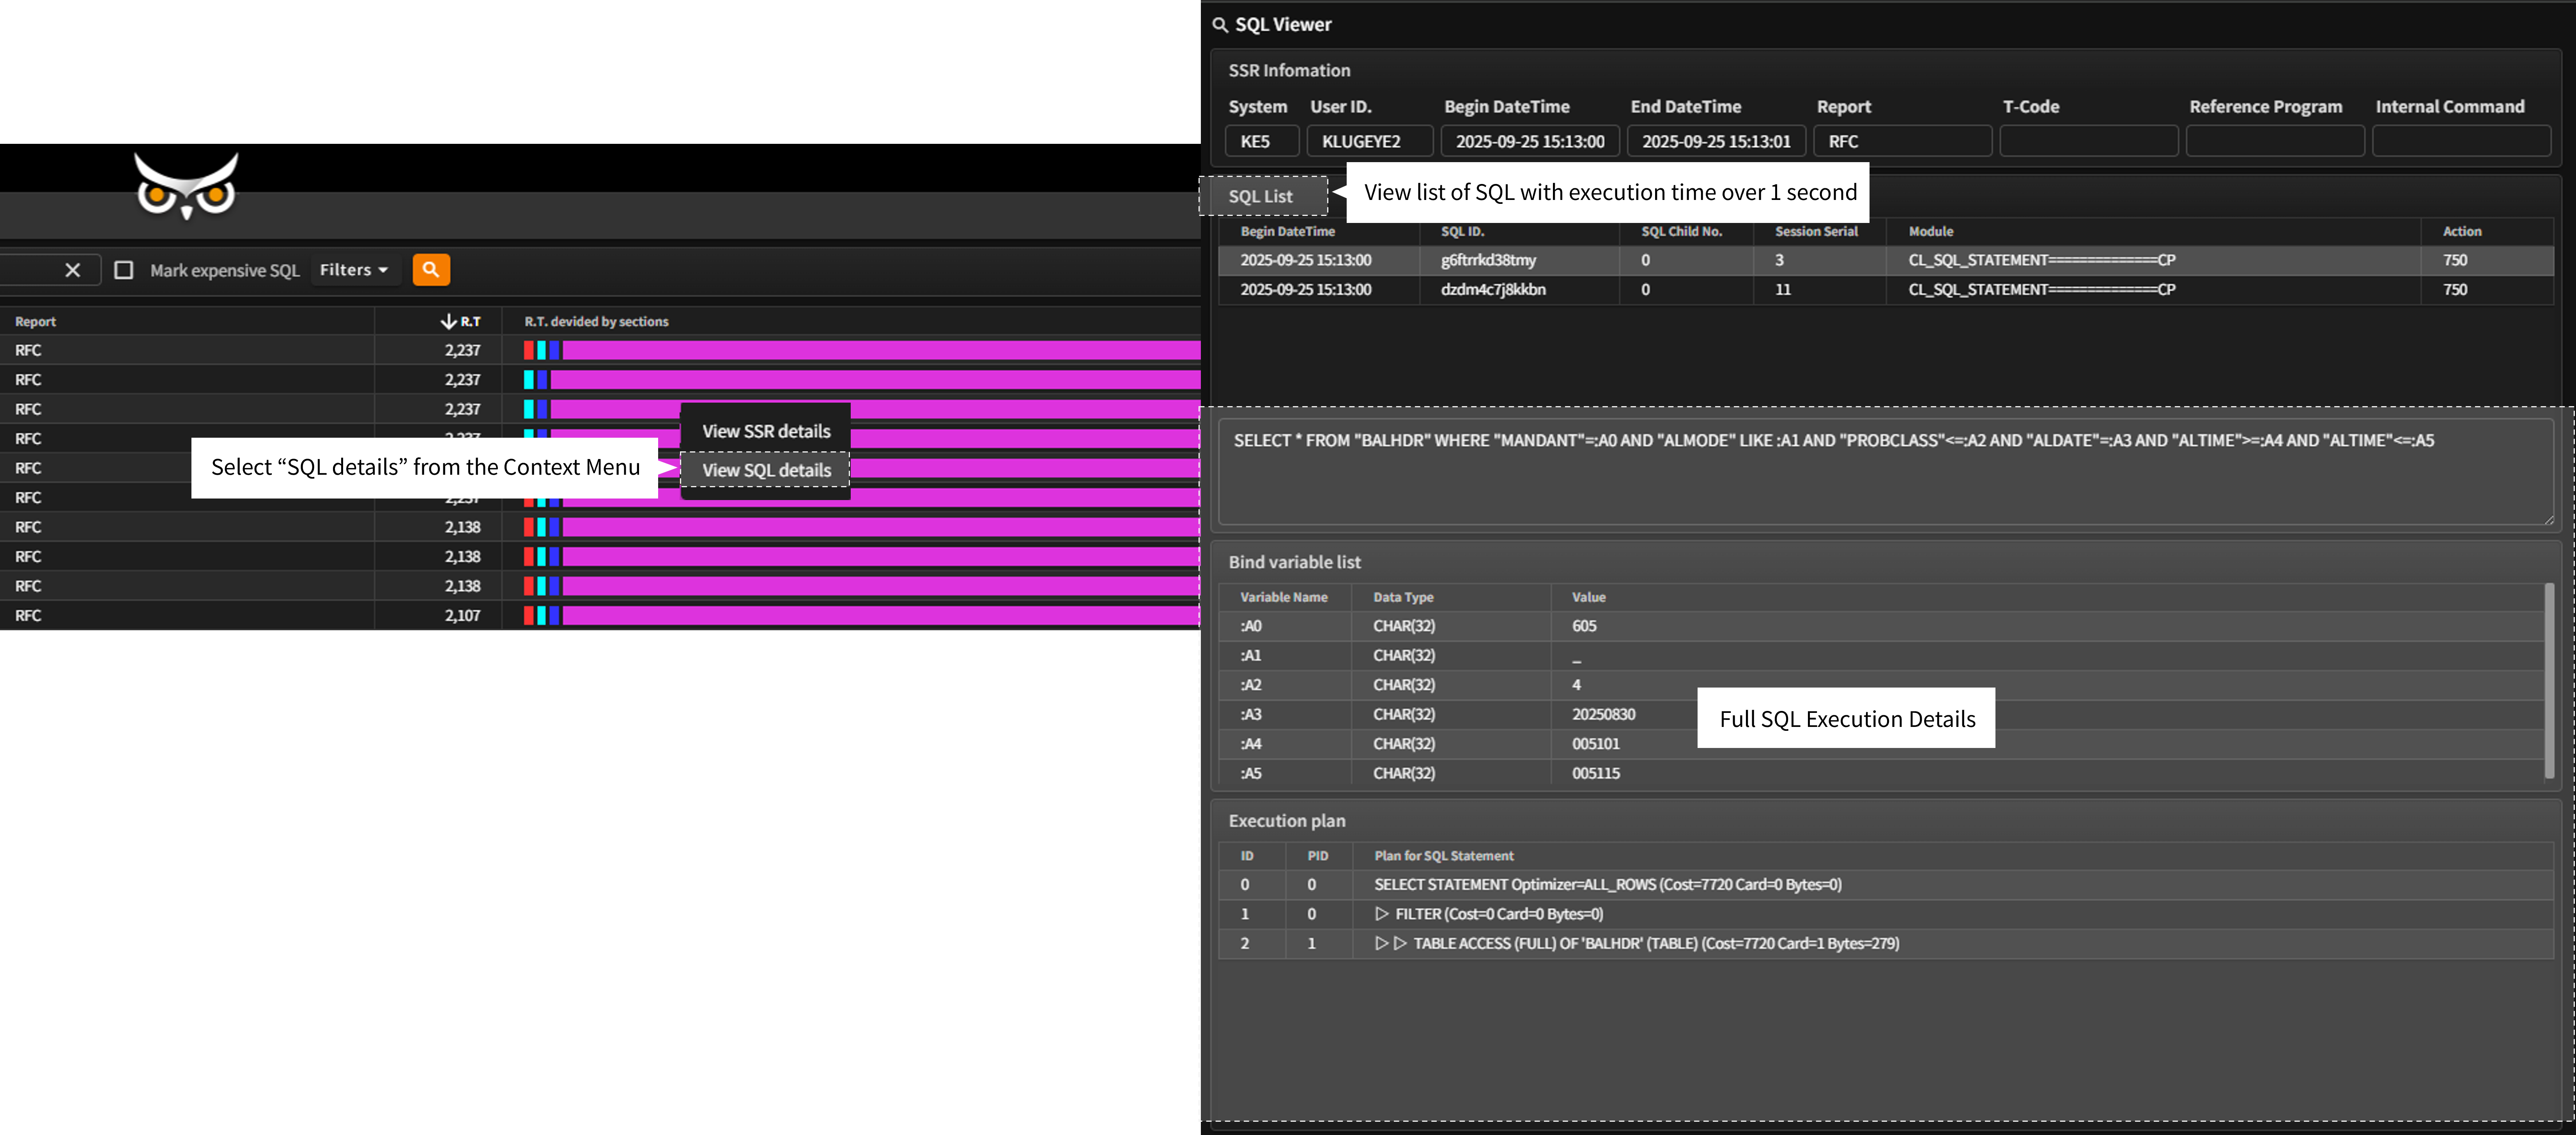
OWLens offers a dedicated SQL Viewer feature that allows users to analyze database-related performance issues in detail.
If the DBMS request time within a program’s execution exceeds 1 second, SQL Viewer displays which SQL statements were executed, what parameters were bound to them, and how these contributed to the response time.
The SQL Viewer can be accessed from the OWLView screen by selecting a specific program entry and choosing “View SSR Details” from the Context Menu.
(This feature is also accessible from the Gantt chart within the Context Analyzer, as described in the “SSR Viewer & Context Analyzer” section.)
- At the top, the SQL Viewer shows key details of the selected program and lists only the SQL statements it executed with a response time exceeding 1 second.
- When you select an SQL entry from the list:
The “SQL Parameters” tab shows the full list of bound parameters used in that execution.
The “SQL Context” tab displays SAP HANA system state information at the time the SQL was executed. - If the total DBMS request time exceeds 1 second but no individual SQL statement took more than 1 second, the SQL list remains empty.
- Instead, the “SAP > DB Call Summary” tab will display a breakdown of:
SQL statement types (DDL), Number of executions, Total response time, And average response time.
- Accurately identify and analyze the root causes of database load or latency at the program level.
- Use detailed SQL diagnostics to optimize system performance.