Key Features
Statistical Analysis ReportStatistical Reports with Various Conditions
- Reports available for OS, response time, transactions, users, top lists, ABAP dumps, duplicate users, etc.
- Periodic reports: daily / weekly / monthly / quarterly / yearly
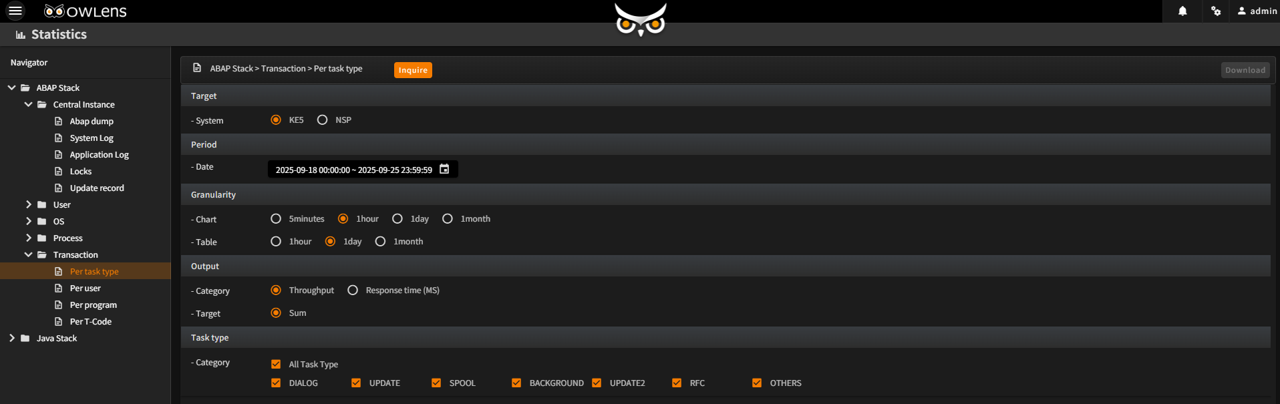
Various filters and condition settings for report generation
- Select report type
- Option to include weekend data
- Select AP servers to include
- Define working hours: day time, night time
- Set report period: day / week / month / quarter / year
- Configure detailed conditions per report category
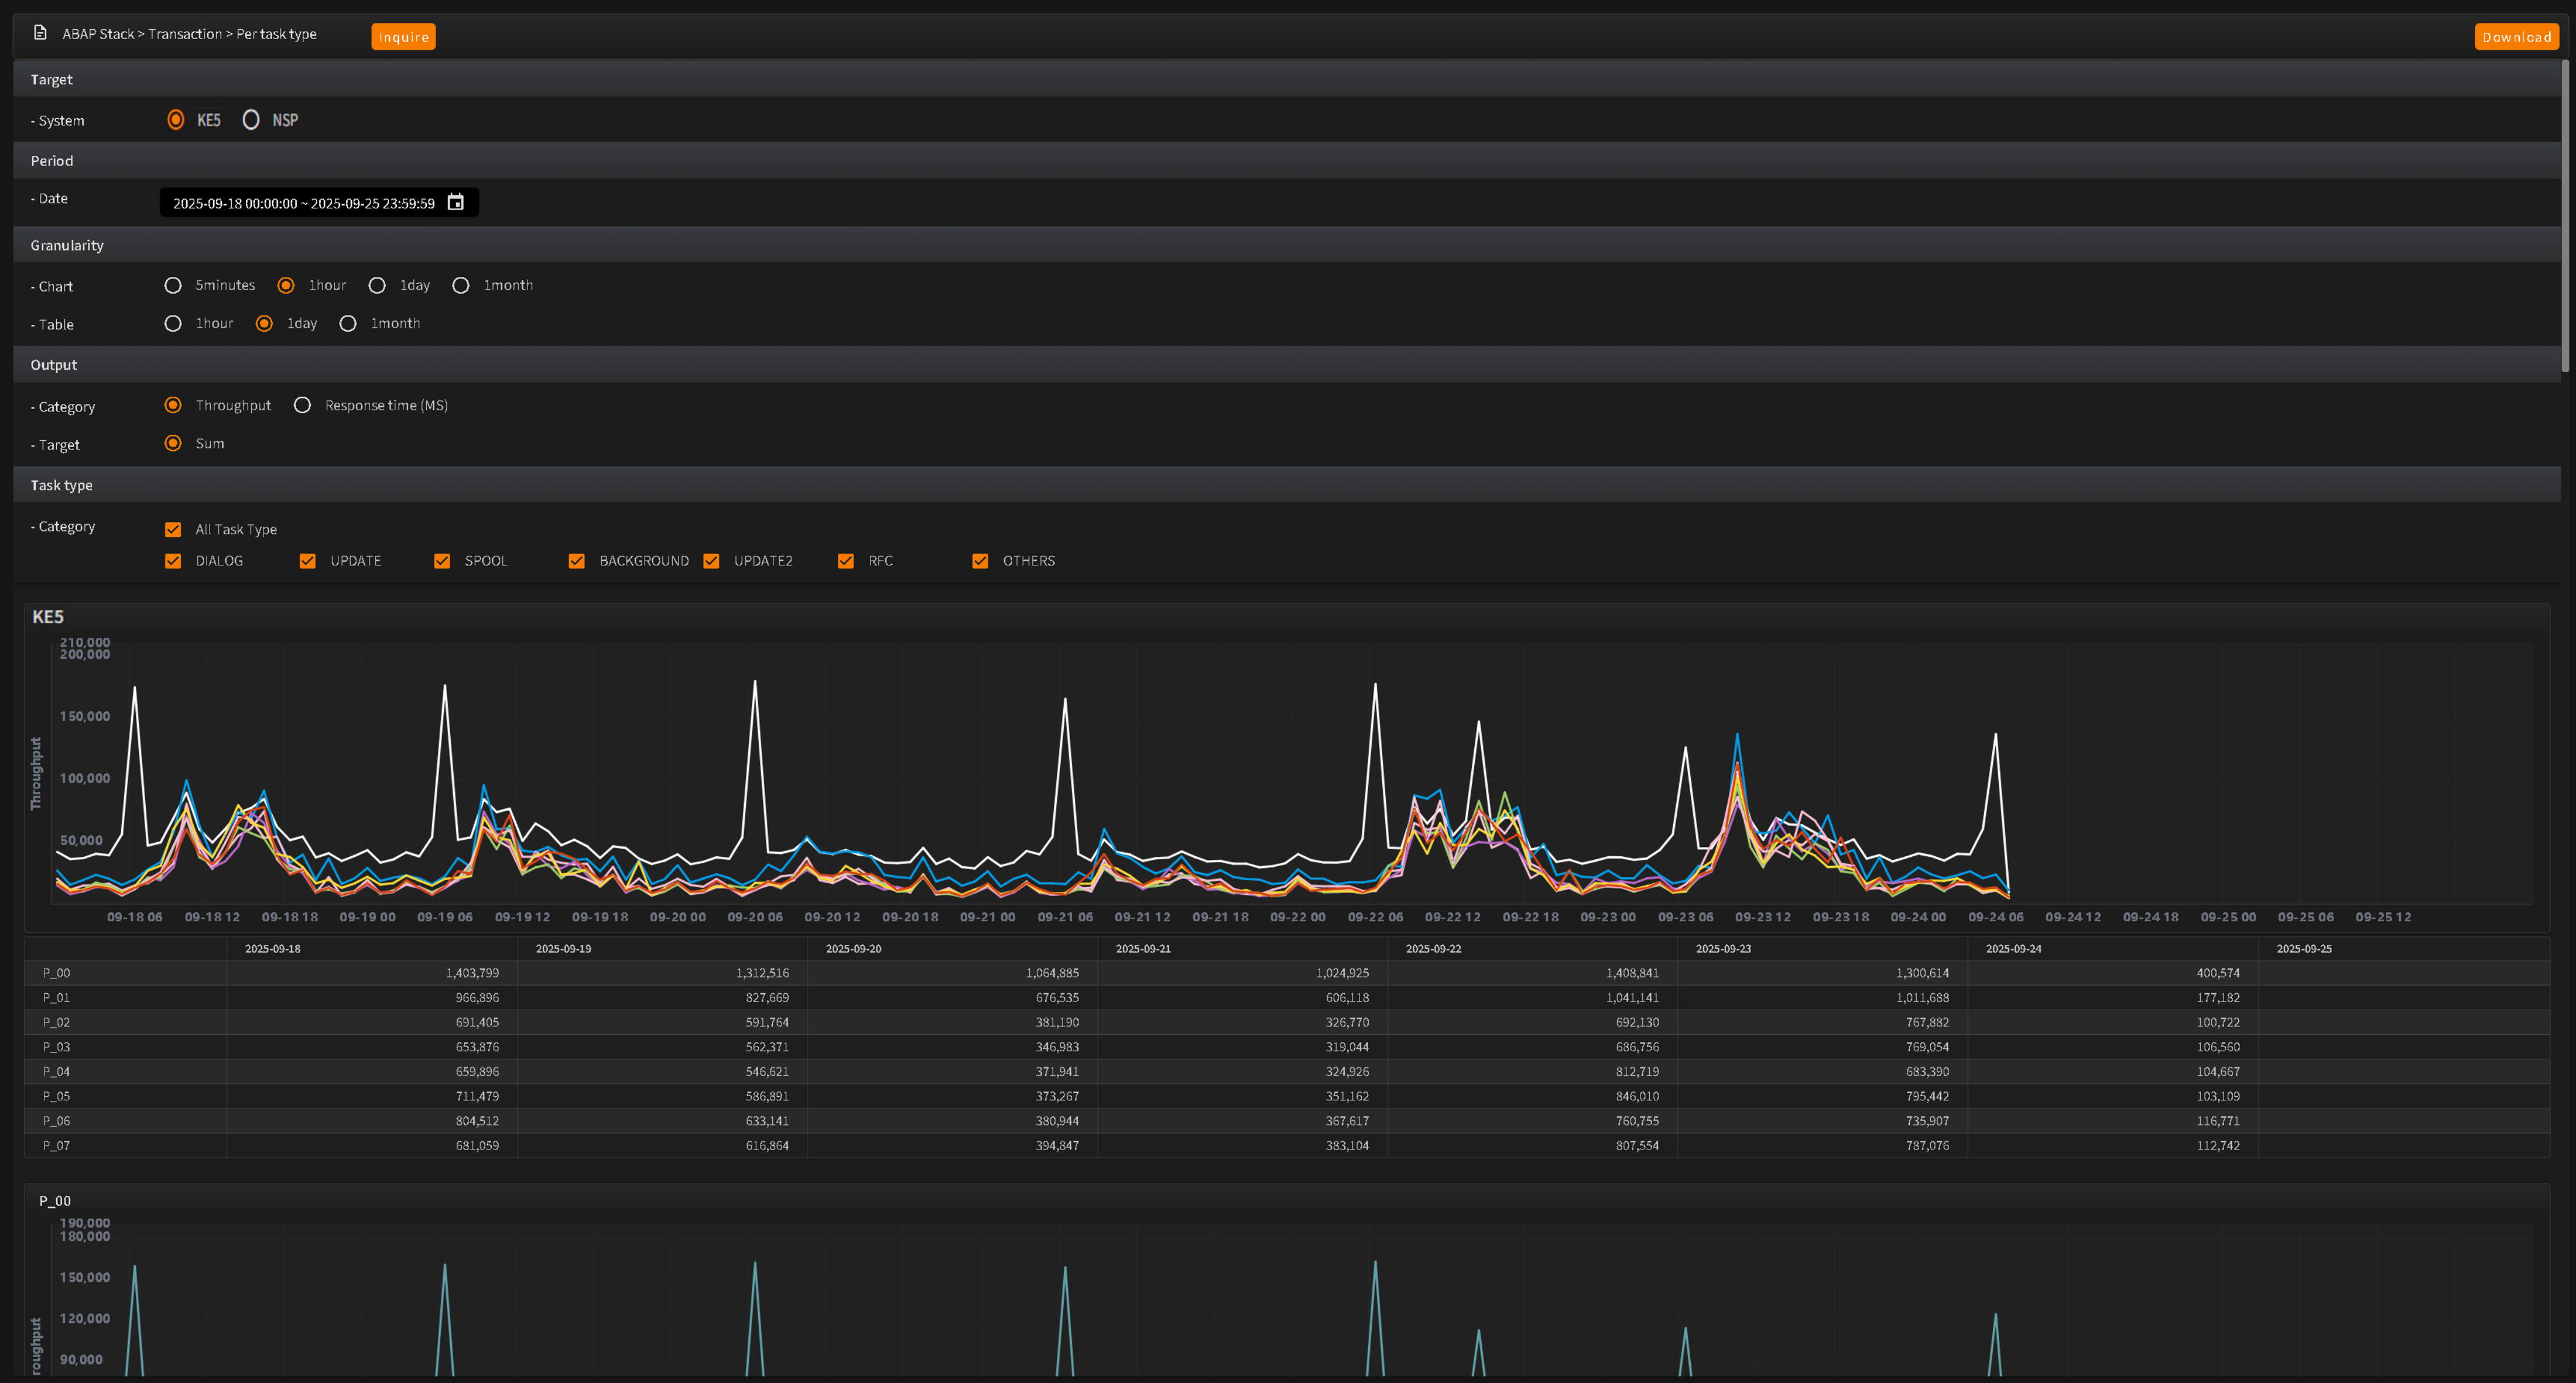
Long-term trend analysis and Excel download support
- Analyze long-term trends within the report
- Download detailed data in Excel format for business utilization
- Provides statistical analysis reports on unused programs and objects
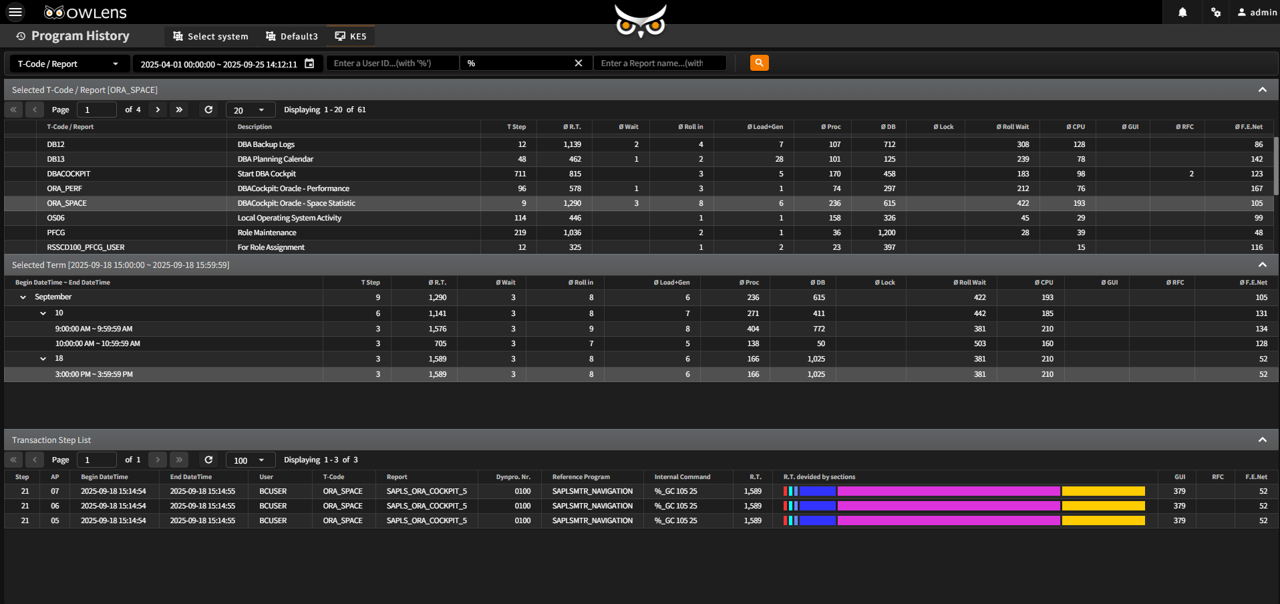
- Generates reports showing execution history of programs over a specified period and identifying those that were not used
- Provides program name pattern search
- Provides details such as number of executions, call time, and last executed user
- Analyzes how frequently specific DB tables are used, including reports on tables with no execution history (Insert, Update, Delete)
- Integrated monitoring and reporting of long-running SQL(over 1 second)
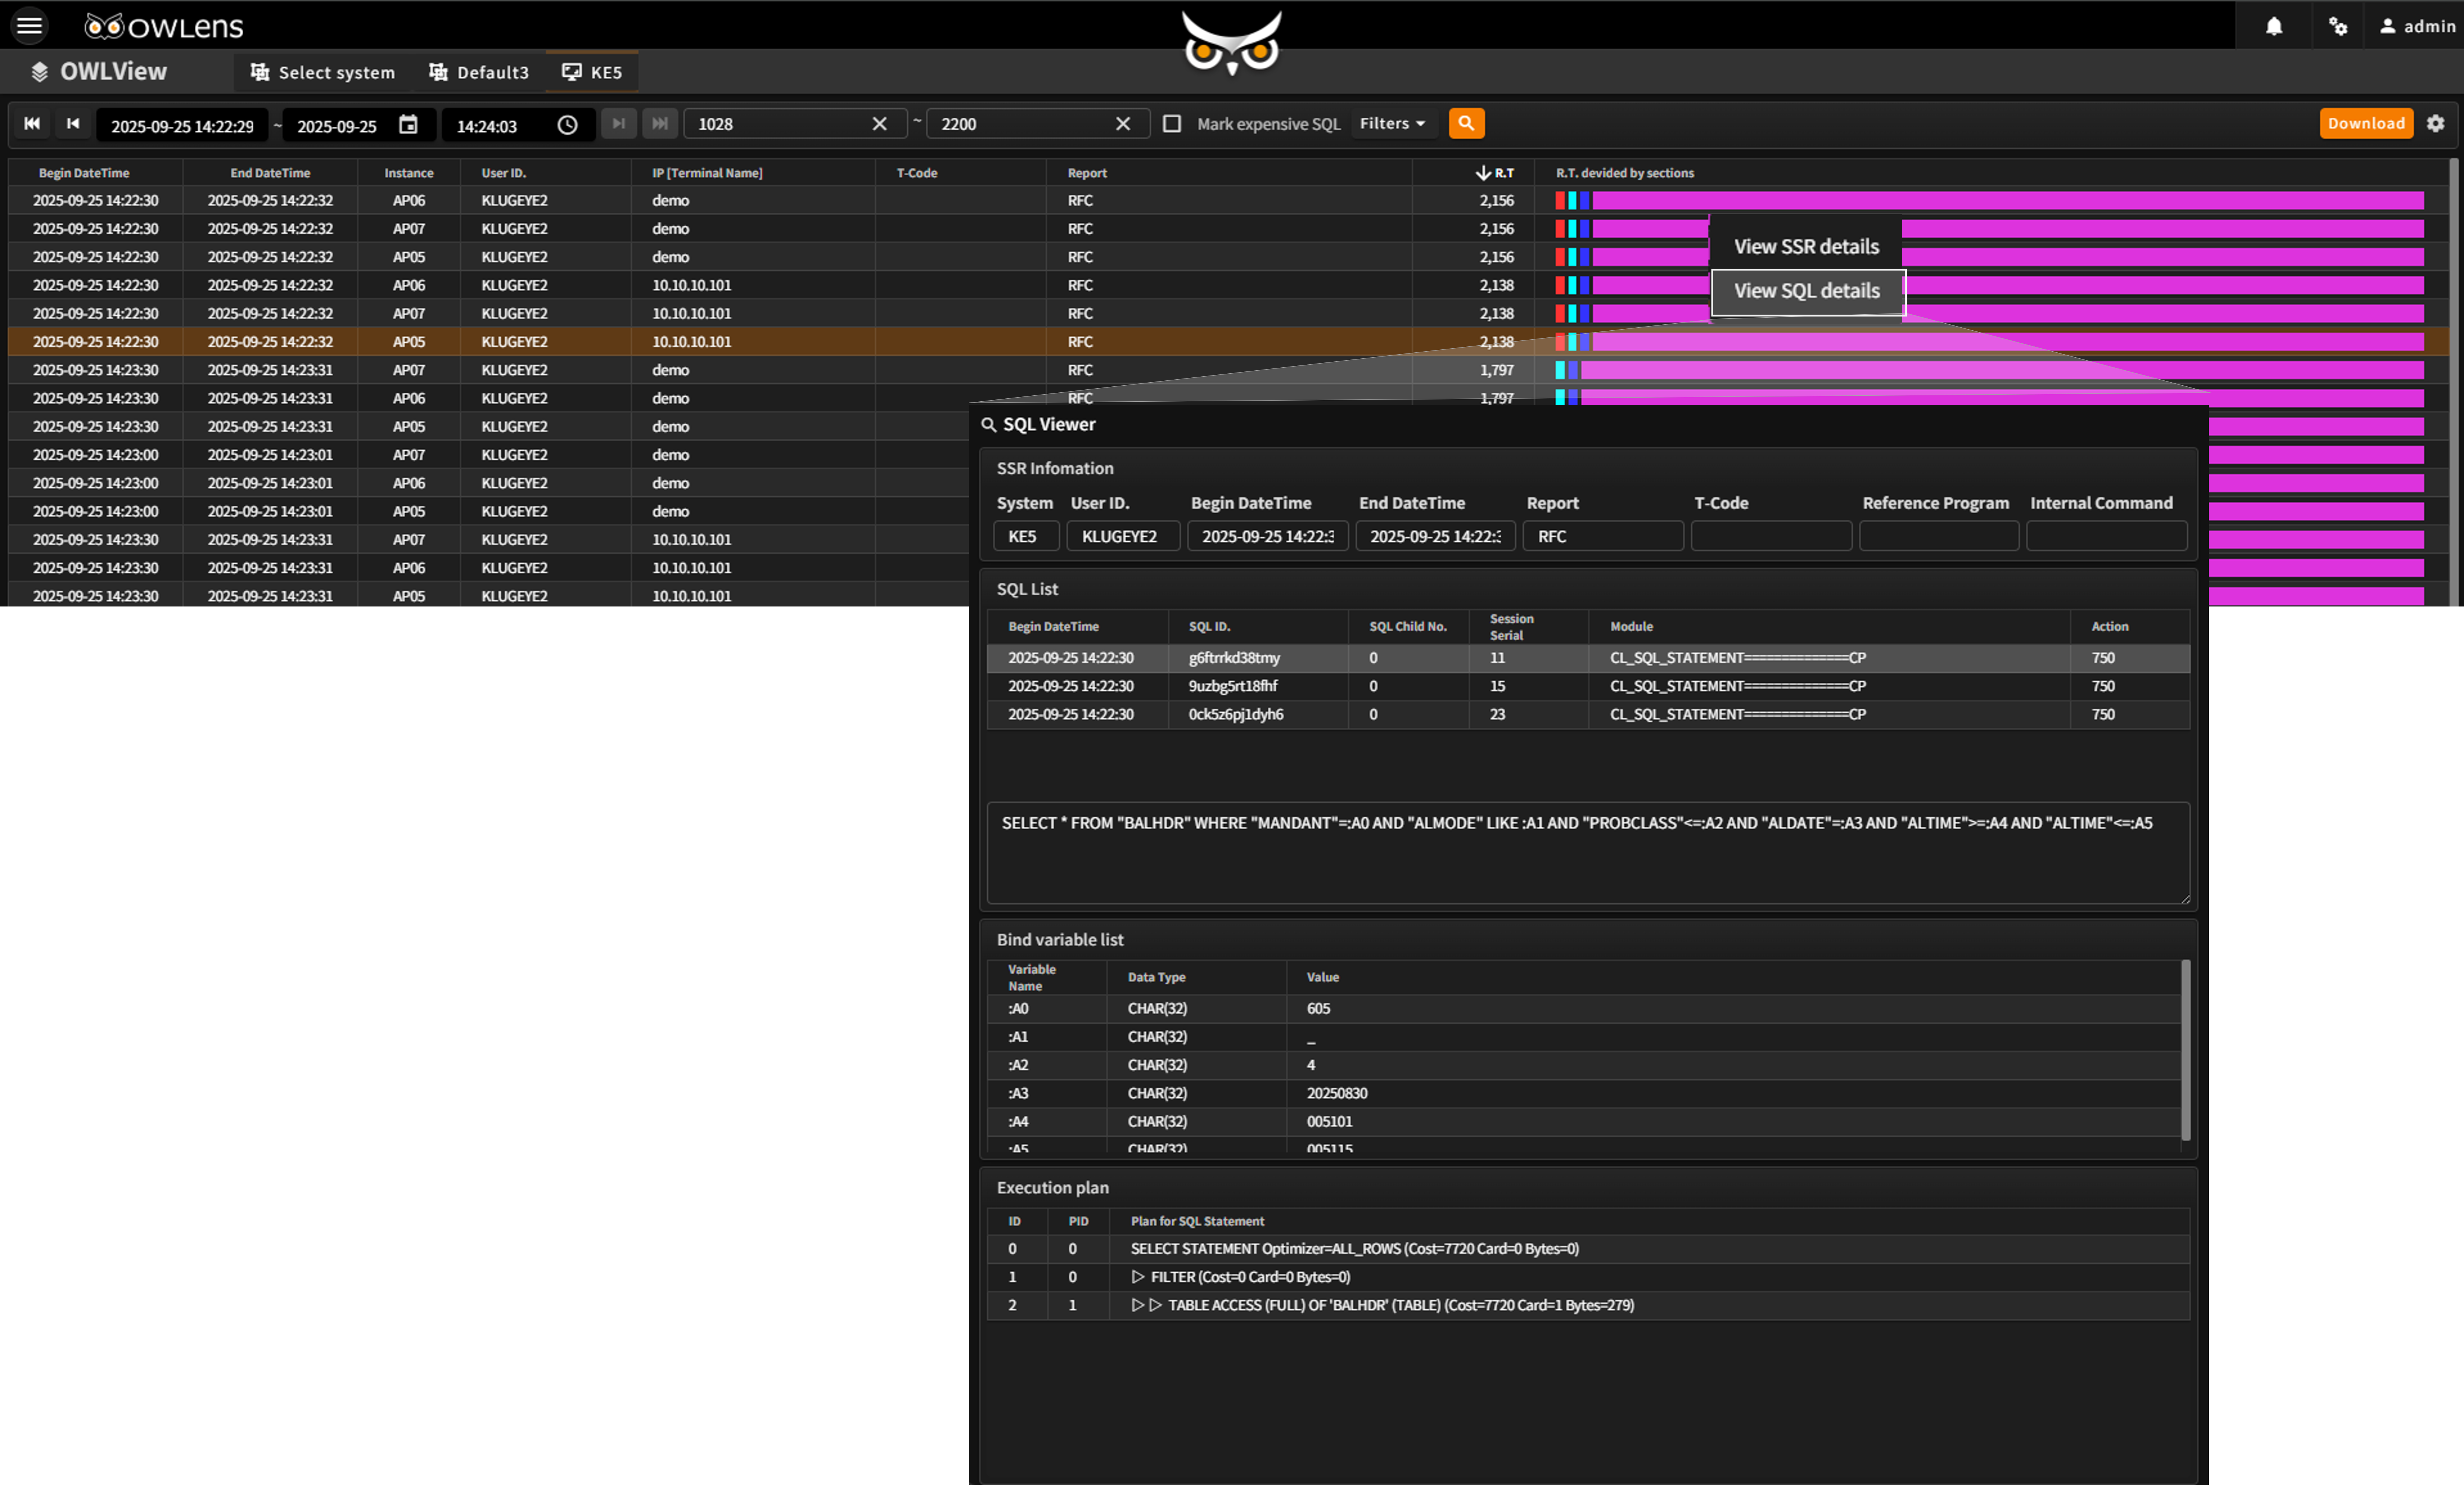
SQL View (Review SQL execution history in user transactions)
- Accessible from Context Analyzer (for correlation analysis), KLUG View, and User Transaction History View
- Provides information on Expensive SQL executed by the DBMS during SAP transaction processing
- Displays SQL statements, bind variables, and execution plans
- Provides a comprehensive view identifying which user (SAP User ID) caused heavy DBMS load during specific report executions
- Enables correlation analysis with real-time data at specific time points during statistical analysis
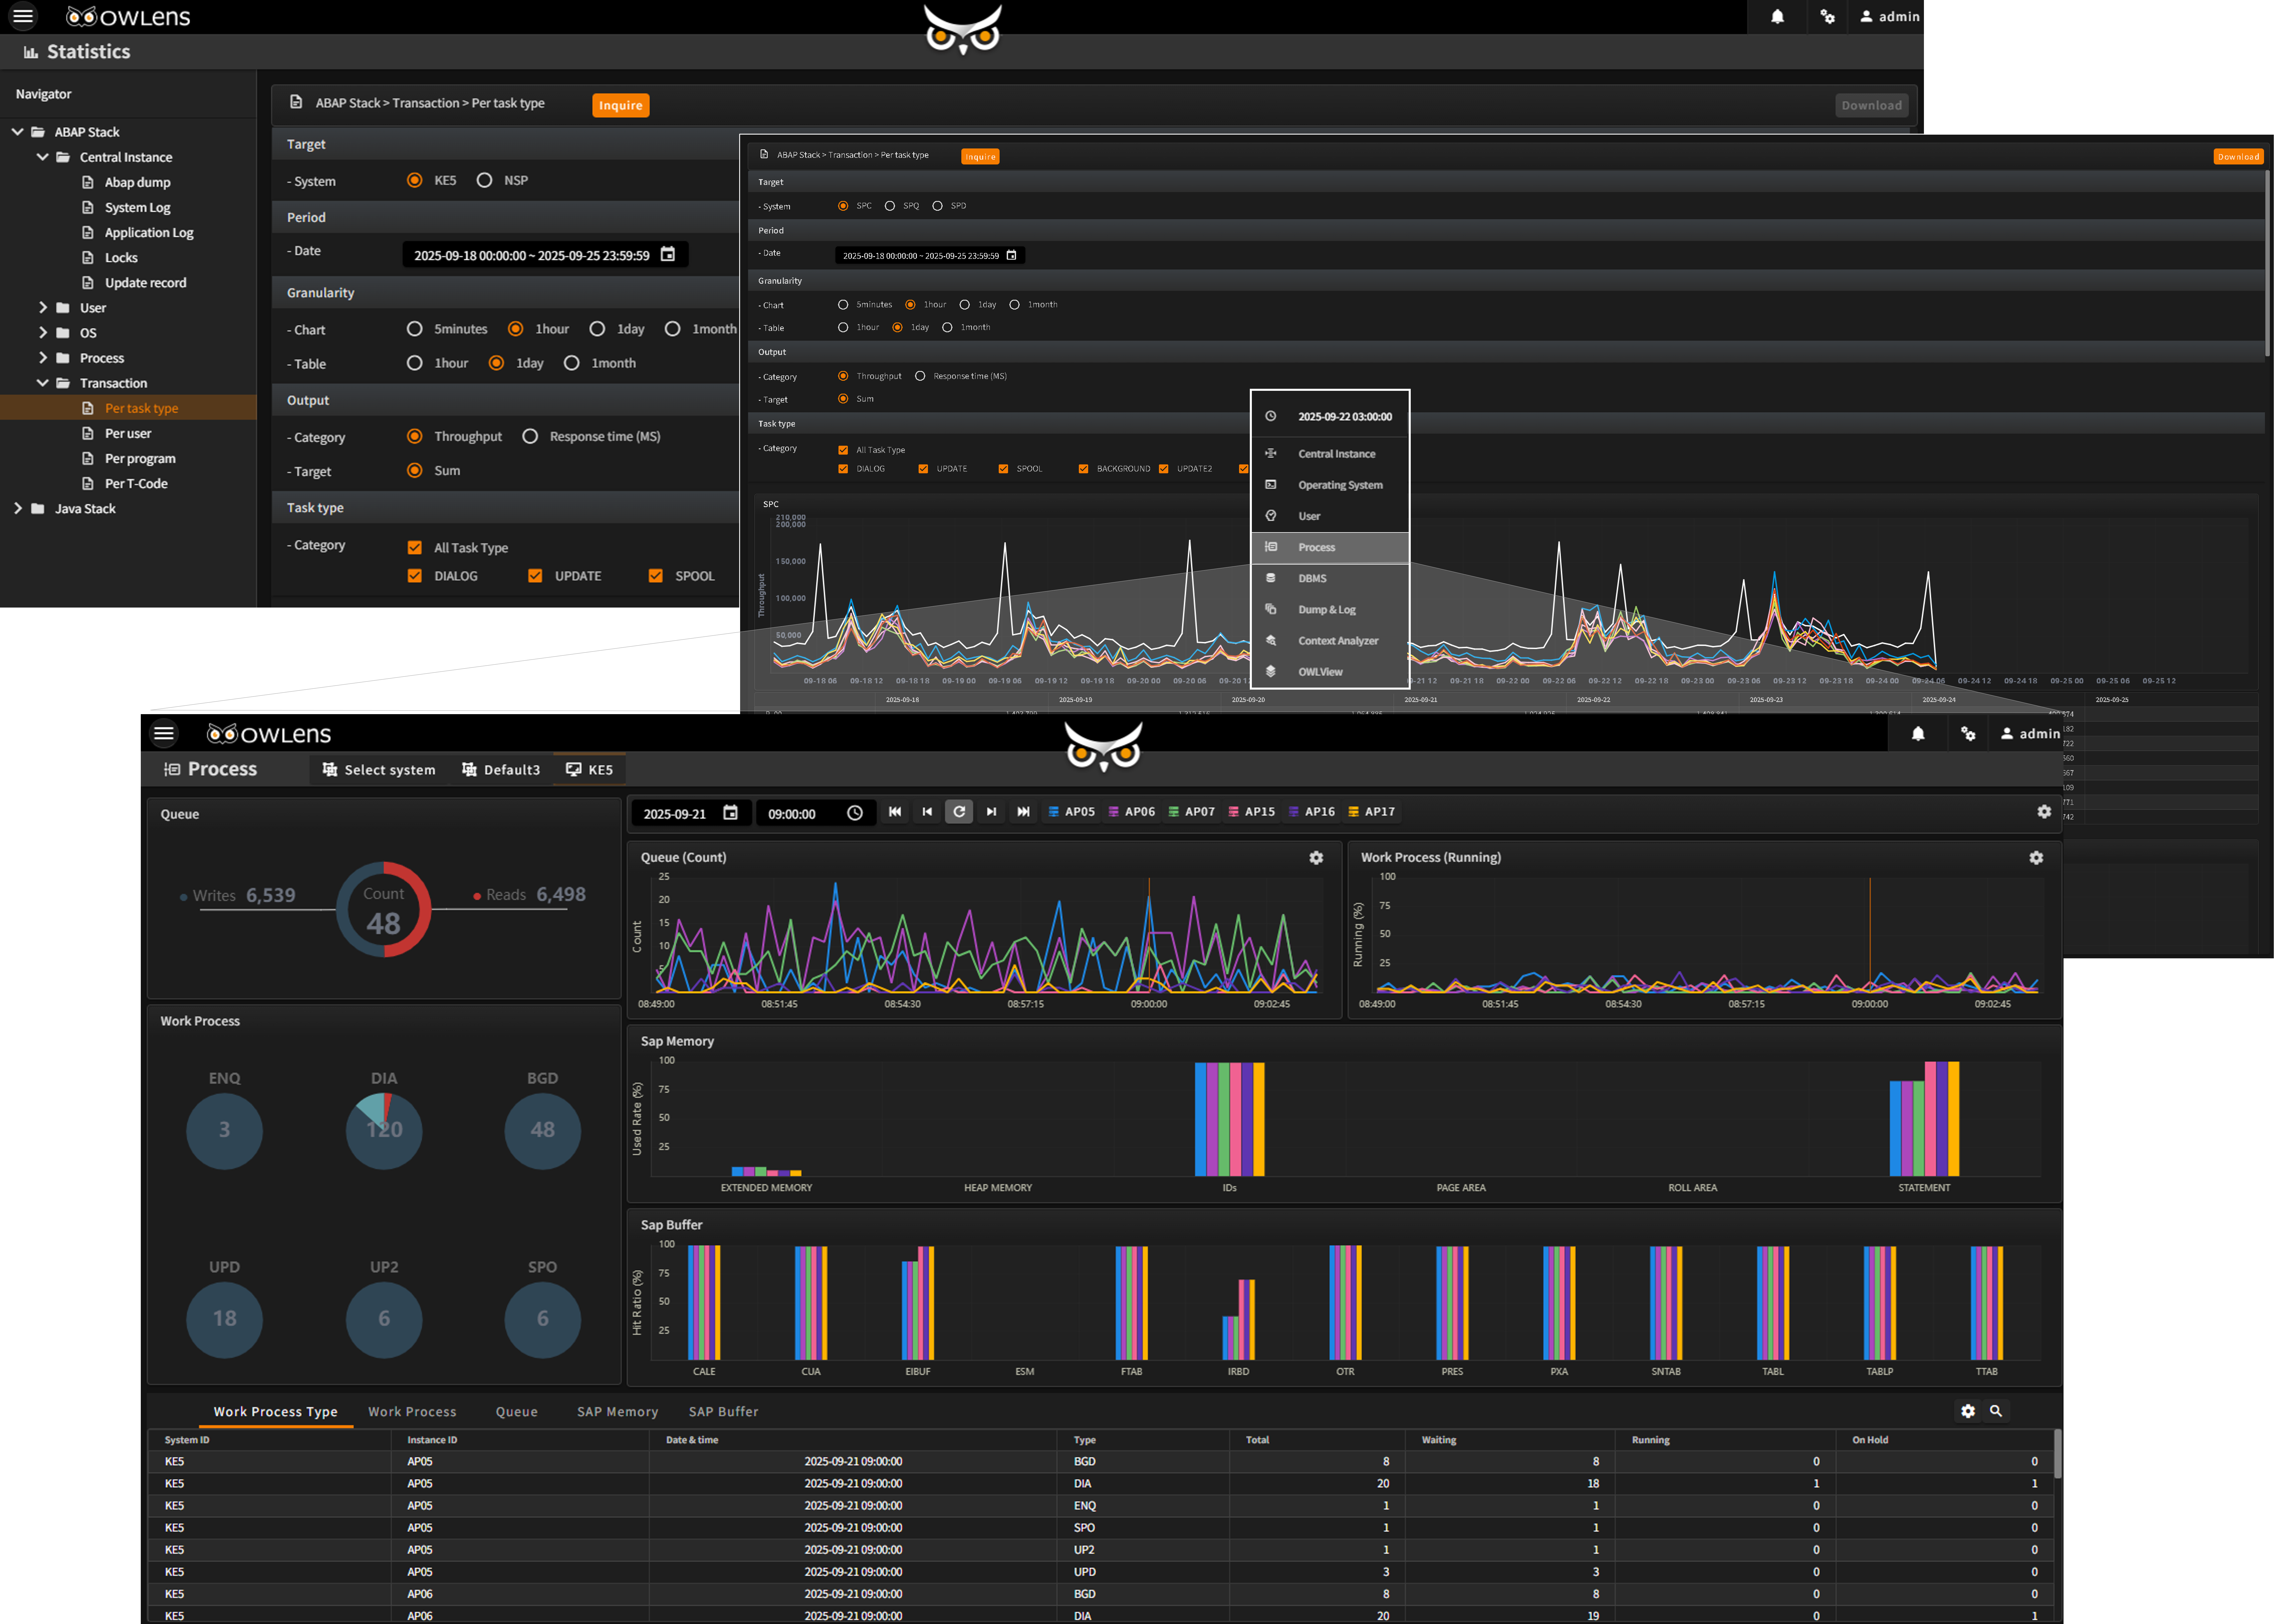
Time Range Configuration for Statistical Analysis
- All hours
- Business hours
- Non-business hours
- Peak business hours
Real-Time Data Integration at Specific Time Points
- Retrieve detailed data for specific metrics at selected time points requiring in-depth analysis
- Provides a list of items on the graph that require correlation analysis
- When selecting a correlation analysis item, detailed information for the corresponding time point is provided
- Useful for investigating past anomalies after identifying long-term trends in the reports