Key Features
Real-time MonitoringMonitoring Items
- Explore the major SAP monitoring targets available in OWLens

| ABAP Central Service |
|
|---|---|
| OS |
|
| SAP Memory |
|
| SAP Process |
|
| User |
|
| Transa-ction |
|
| JAVA Central Service |
|
| Dispa-tcher |
|
| ICM |
|
| JVM |
|
| JDBC |
|
| Miscella-neous |
|
- Supports customization of monitoring items and their collection intervals
- Administrator can configure high-frequency (second-level) collection for real-time needs

- SAP Buffer/Memory/Work Process/Logon User : 10/15/30/60초, Default : 15초
- ABAP Dump, SSR(Transaction) : 10/15/30/60초, Default : 30초
- OS CPU/Memory/Disk/Network : 10/15/30/60초, Default : 60초
- Collects detailed SSR data at second-level intervals
- Supports program-level monitoring of transaction response times using collected SSR data
- Monitors all transaction types with filtering options to focus on specific types as needed
- Provides granular response time breakdowns, including:Processing Time, DB Time, GUI Time, and more
- OWLView - The Most Advanced Visualization for SAP Transaction Response Analysis
OWLView chart
- Visualizes transaction steps on a 3-second interval scale:
X-axis: Response Time, Y-axis: Time (chronological) - Allows users to drag and select areas of interest directly on the chart
- Identify system anomalies through scattered patterns and behavior clusters
OWLView grid
- Displays a detailed breakdown of selected transaction steps from the chart in a structured grid
- Sorts and visualizes by:
Execution time, System/Instance, User, Report, Total Response Time, Segmented Response Time - Supports contextual integration with SSR Viewer and SQL Viewer for deeper analysis
- Real-time monitoring of duplicate logins and session history
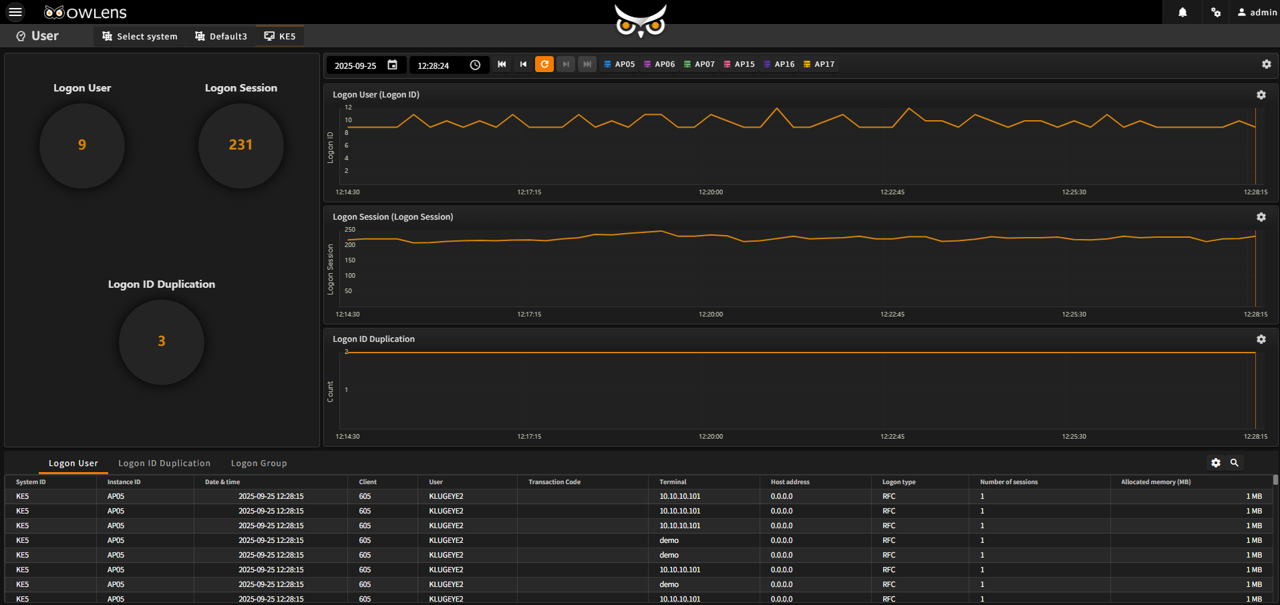
- Monitors users who log in from multiple terminals using the same user ID on the same AP server
- Provides detailed session information including:
User name, Hostname, IP address, Client name, and Number of sessions
- In-depth monitoring of specific past points in time
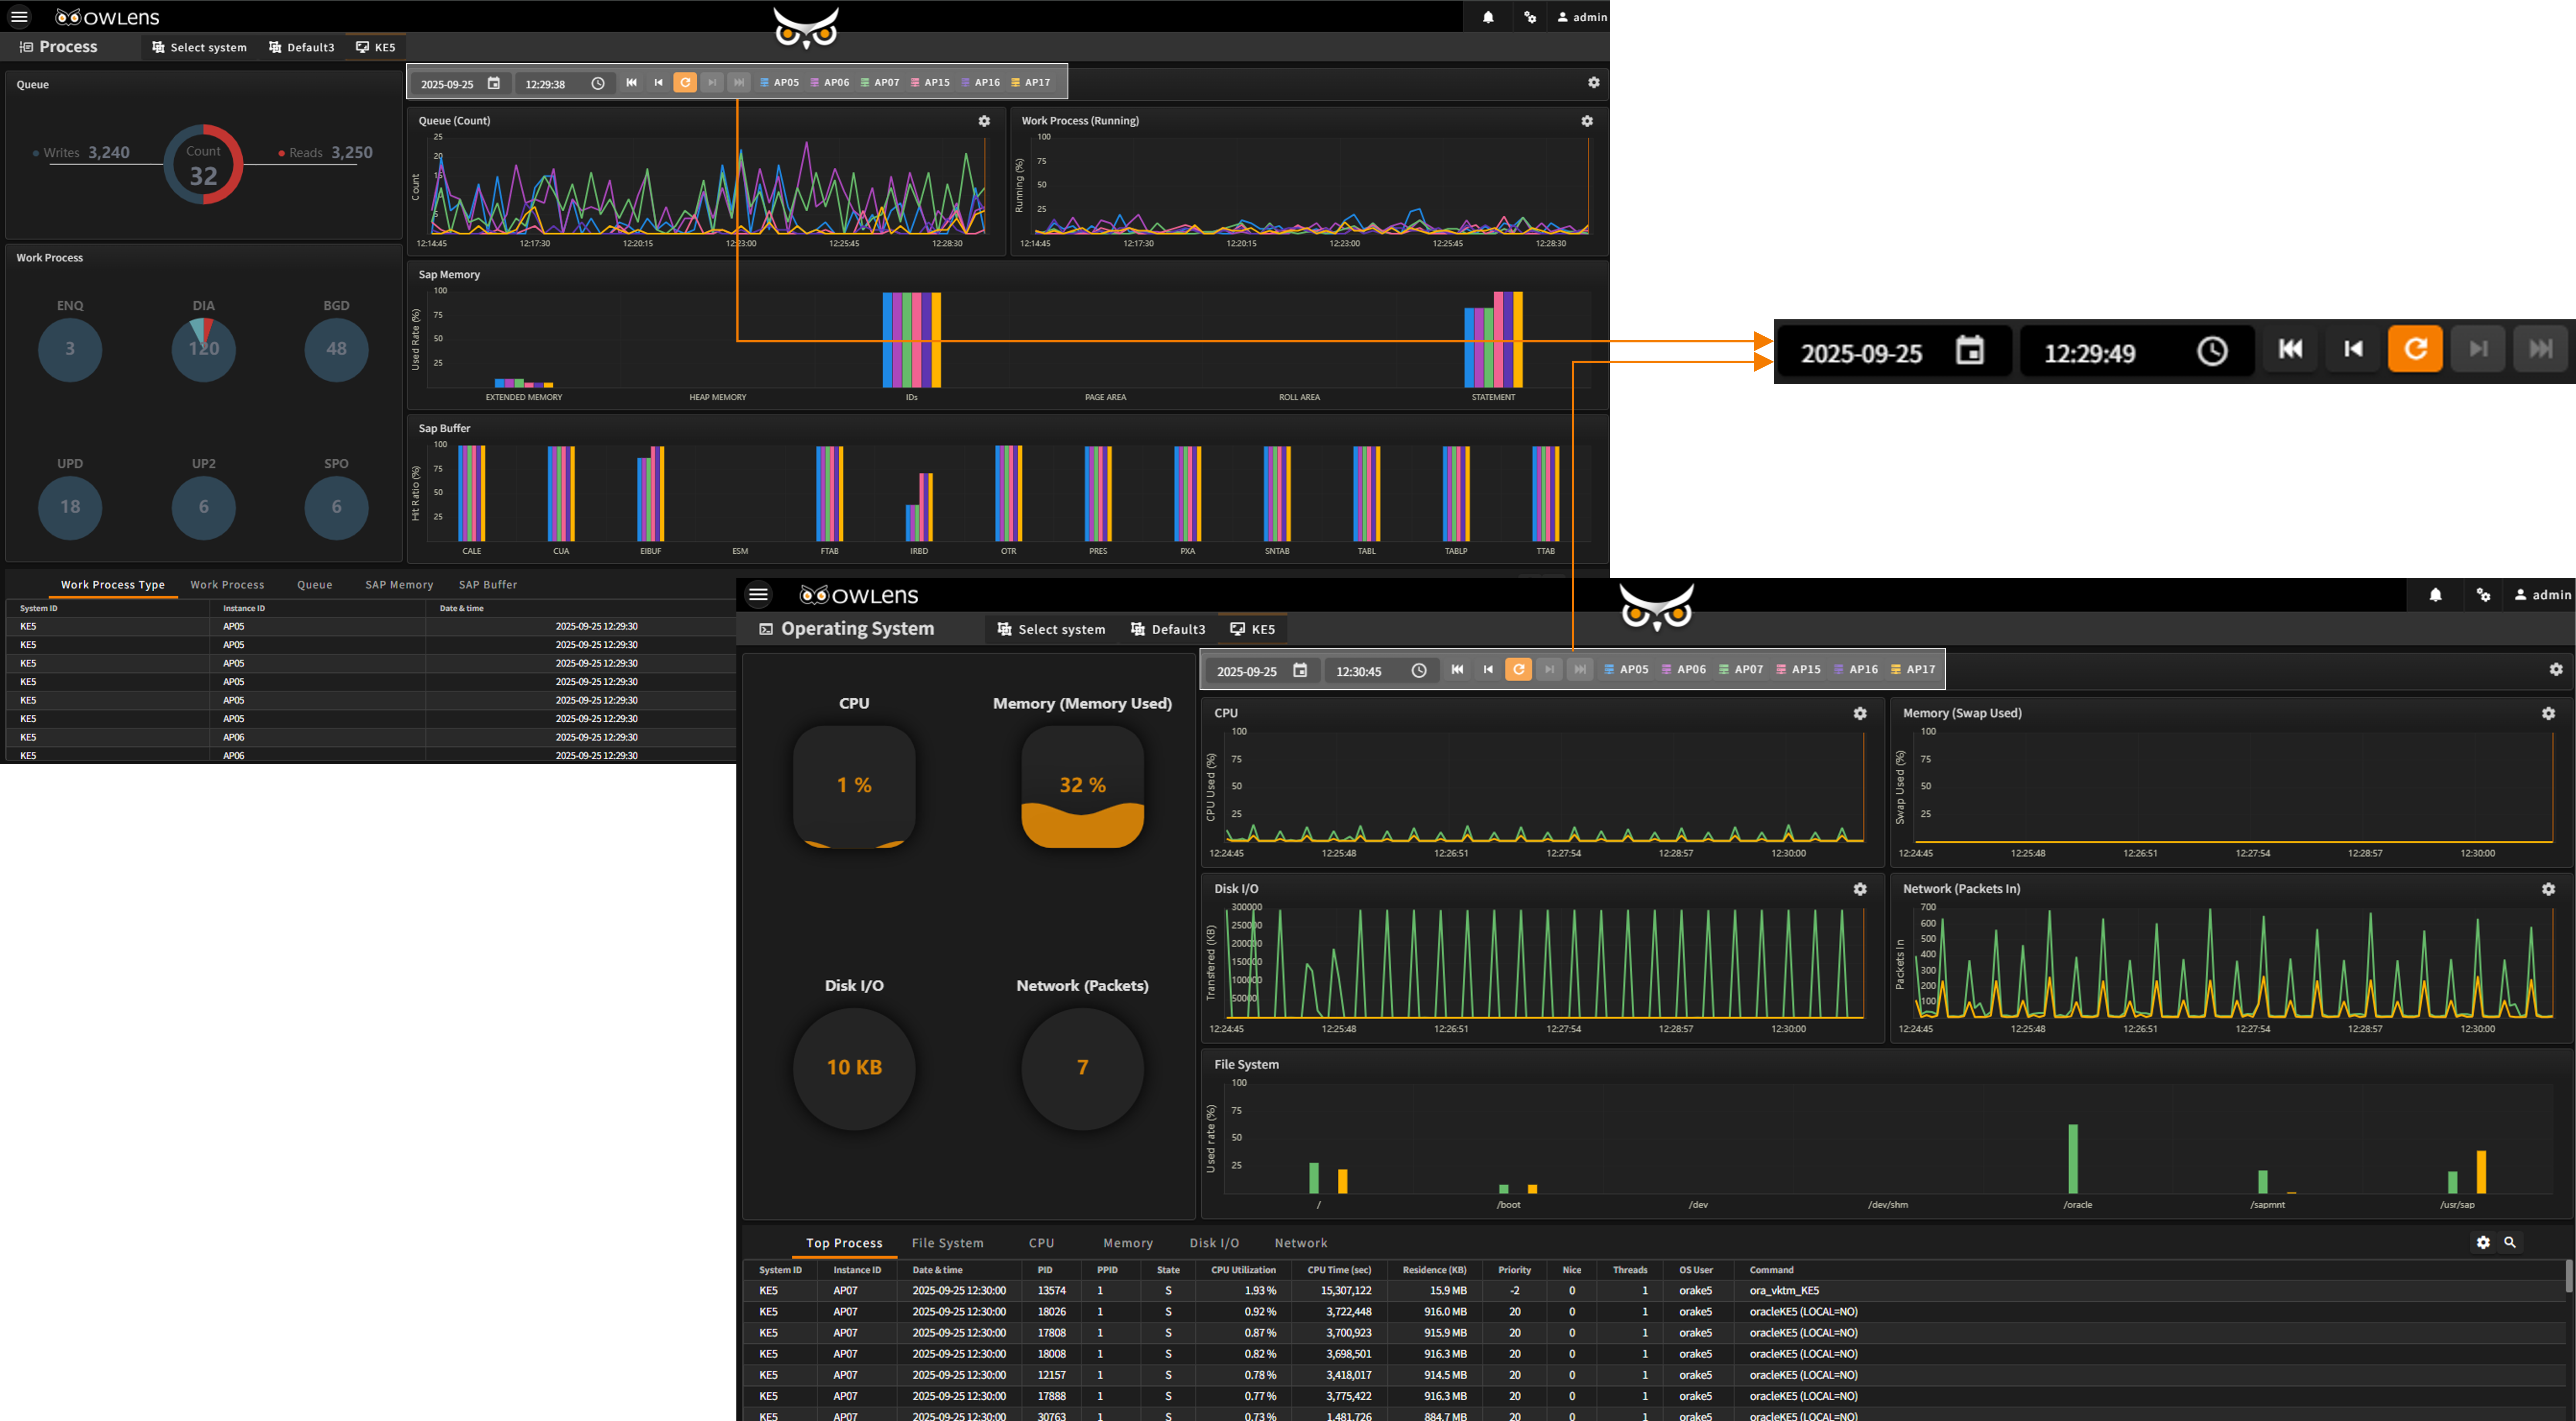
Time Navigator
- Reproduce any point in time by manipulating the real-time chart’s Time Navigator
- Accurately reconstruct system conditions from historical data without loss
- Enables fast and intuitive root-cause analysis for past issues