Key Features
Context AnalyzerSystem Context Data at the Time of Issue
- Provides detailed system context data for specific situations to quickly identify the root cause of issues.
Context Analyzer – Root Cause Analysis
- Performs system-wide contextual analysis based on the environment at the time of the issue (e.g., when an alert occurs or a problem arises).
- Helps users quickly identify the root cause of issues by examining the full context surrounding the problem.
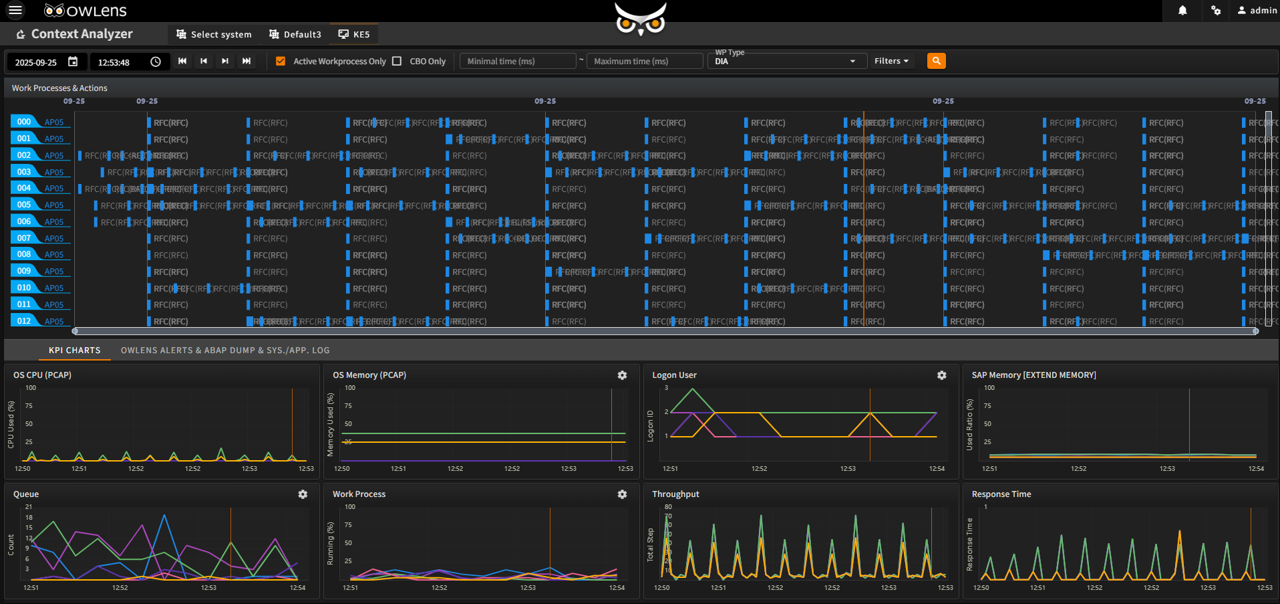
- Visualizes the status of transaction steps in the system using a Gantt chart.
Transaction Step Gantt Chart
- Provides a Gantt chart view of transaction steps occurring across all AP in the SAP system.
- Provides integrated KPI performance insights at the moment a system transaction step is triggered
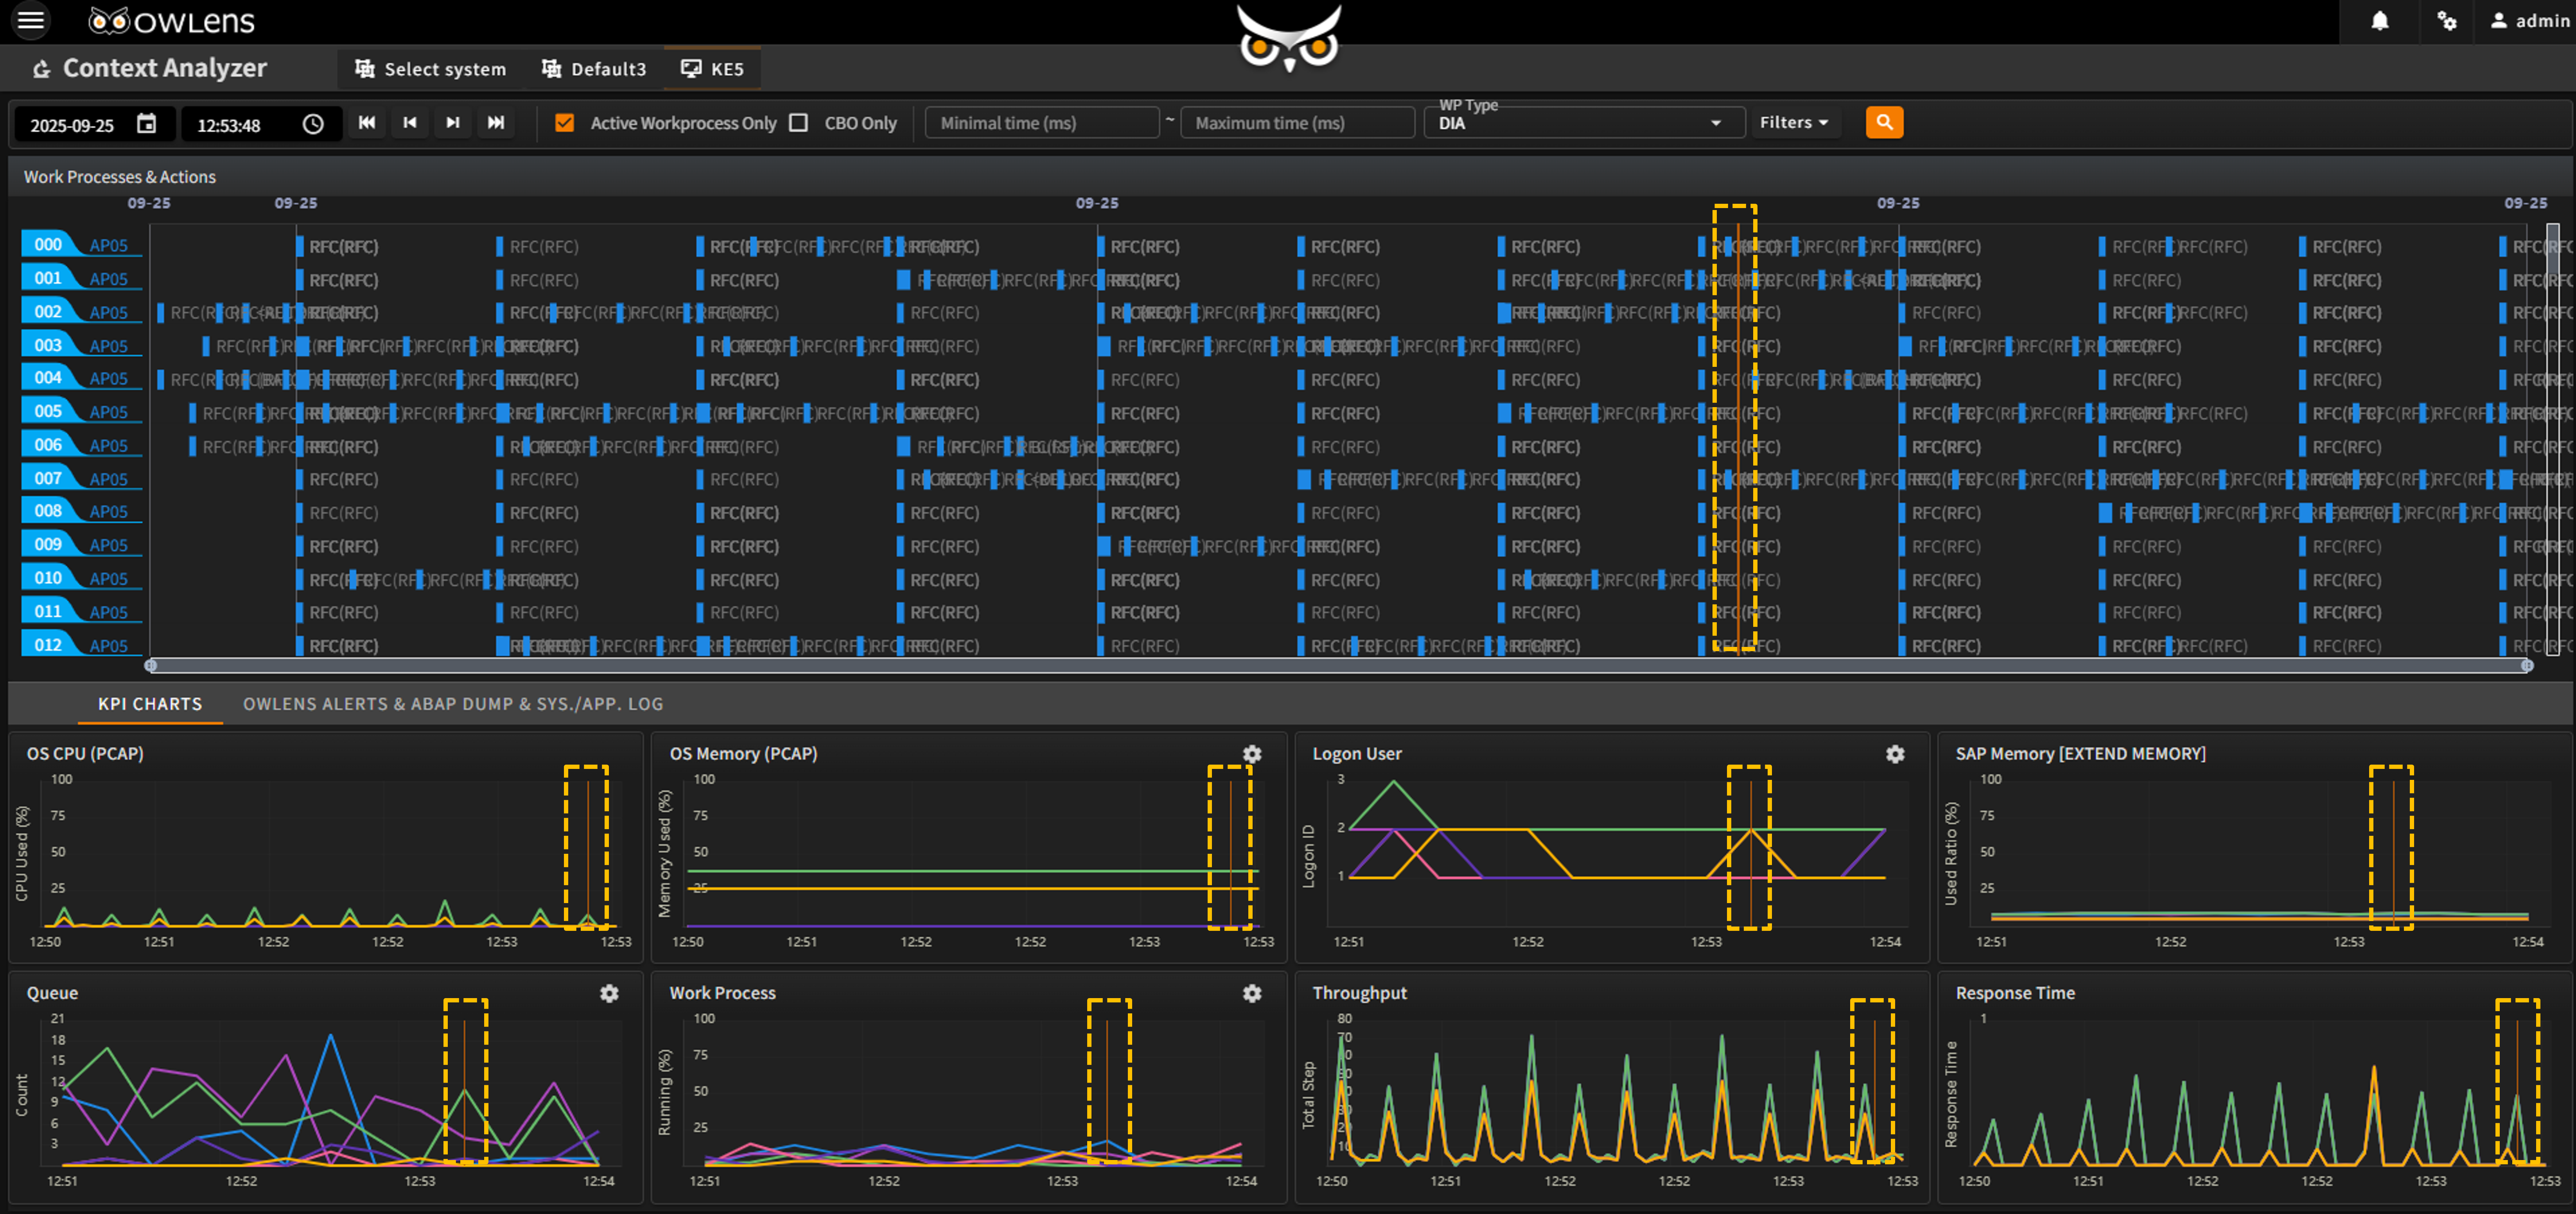
Simplified Correlation Analysis with Integrated KPI Data
- When a specific point is clicked on the transaction step Gantt chart, a visual guideline appears on the chart (indicated by a yellow dotted line in the top UI)
- Below the Gantt chart, trend graphs of major system performance indicators (KPIs) are displayed — including CPU, memory, user count, extended memory, queue, work processes, throughput, and response time
- The visual guideline on the upper Gantt chart is synchronized with all trend graphs below
- Enables intuitive understanding of the correlation between system performance conditions and transactions
- Provides a consolidated view of ALERTs, ABAP Dumps, and Logs aligned with the execution timing of transaction steps
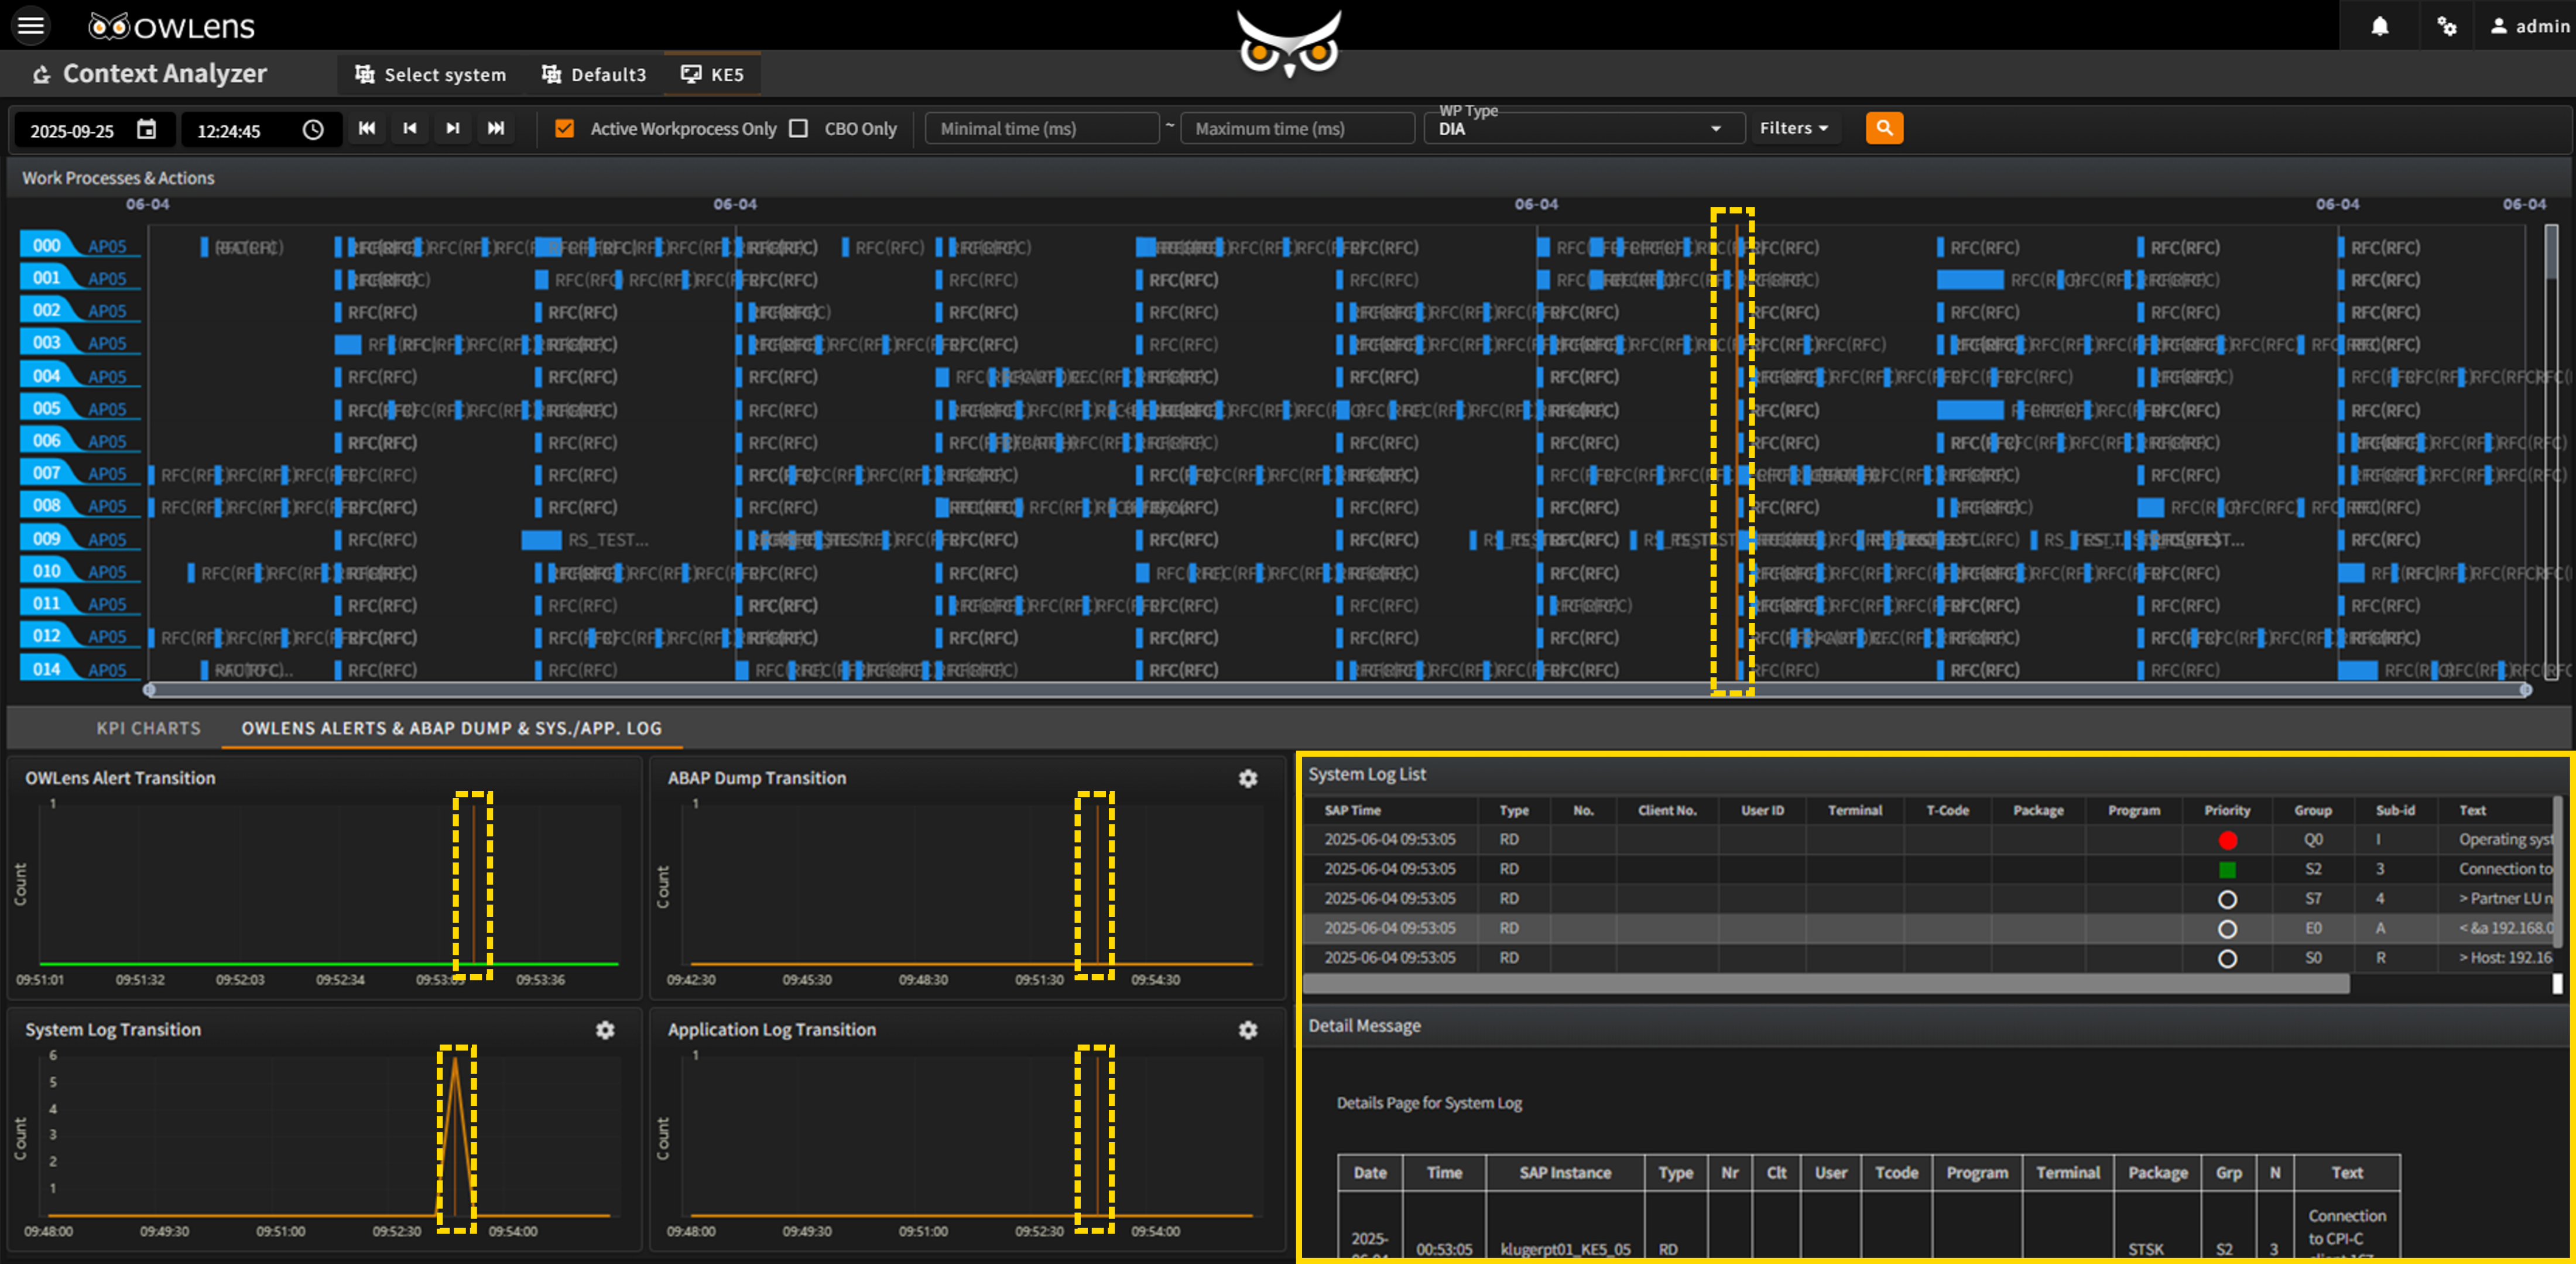
Enables seamless correlation analysis by integrating OWLens ALERTs, SAP ABAP Dumps, and System/Application Logs
- When a specific point is selected on the transaction step Gantt chart, a visual indicator line appears (yellow dashed line in the top UI).
- Below the Gantt chart, trend charts display occurrences of ALERTs, Dumps, and Logs.
- Easily identify the correlation between various ALERTs, Dumps, Logs, and transaction activity.
- Detailed information about each ALERT, Dump, and Log is provided in a single unified screen to support convenient root cause analysis.