Use Cases
Realtime Monitoring - OWLViewWhich ABAP programs were running at the time of peak system load?
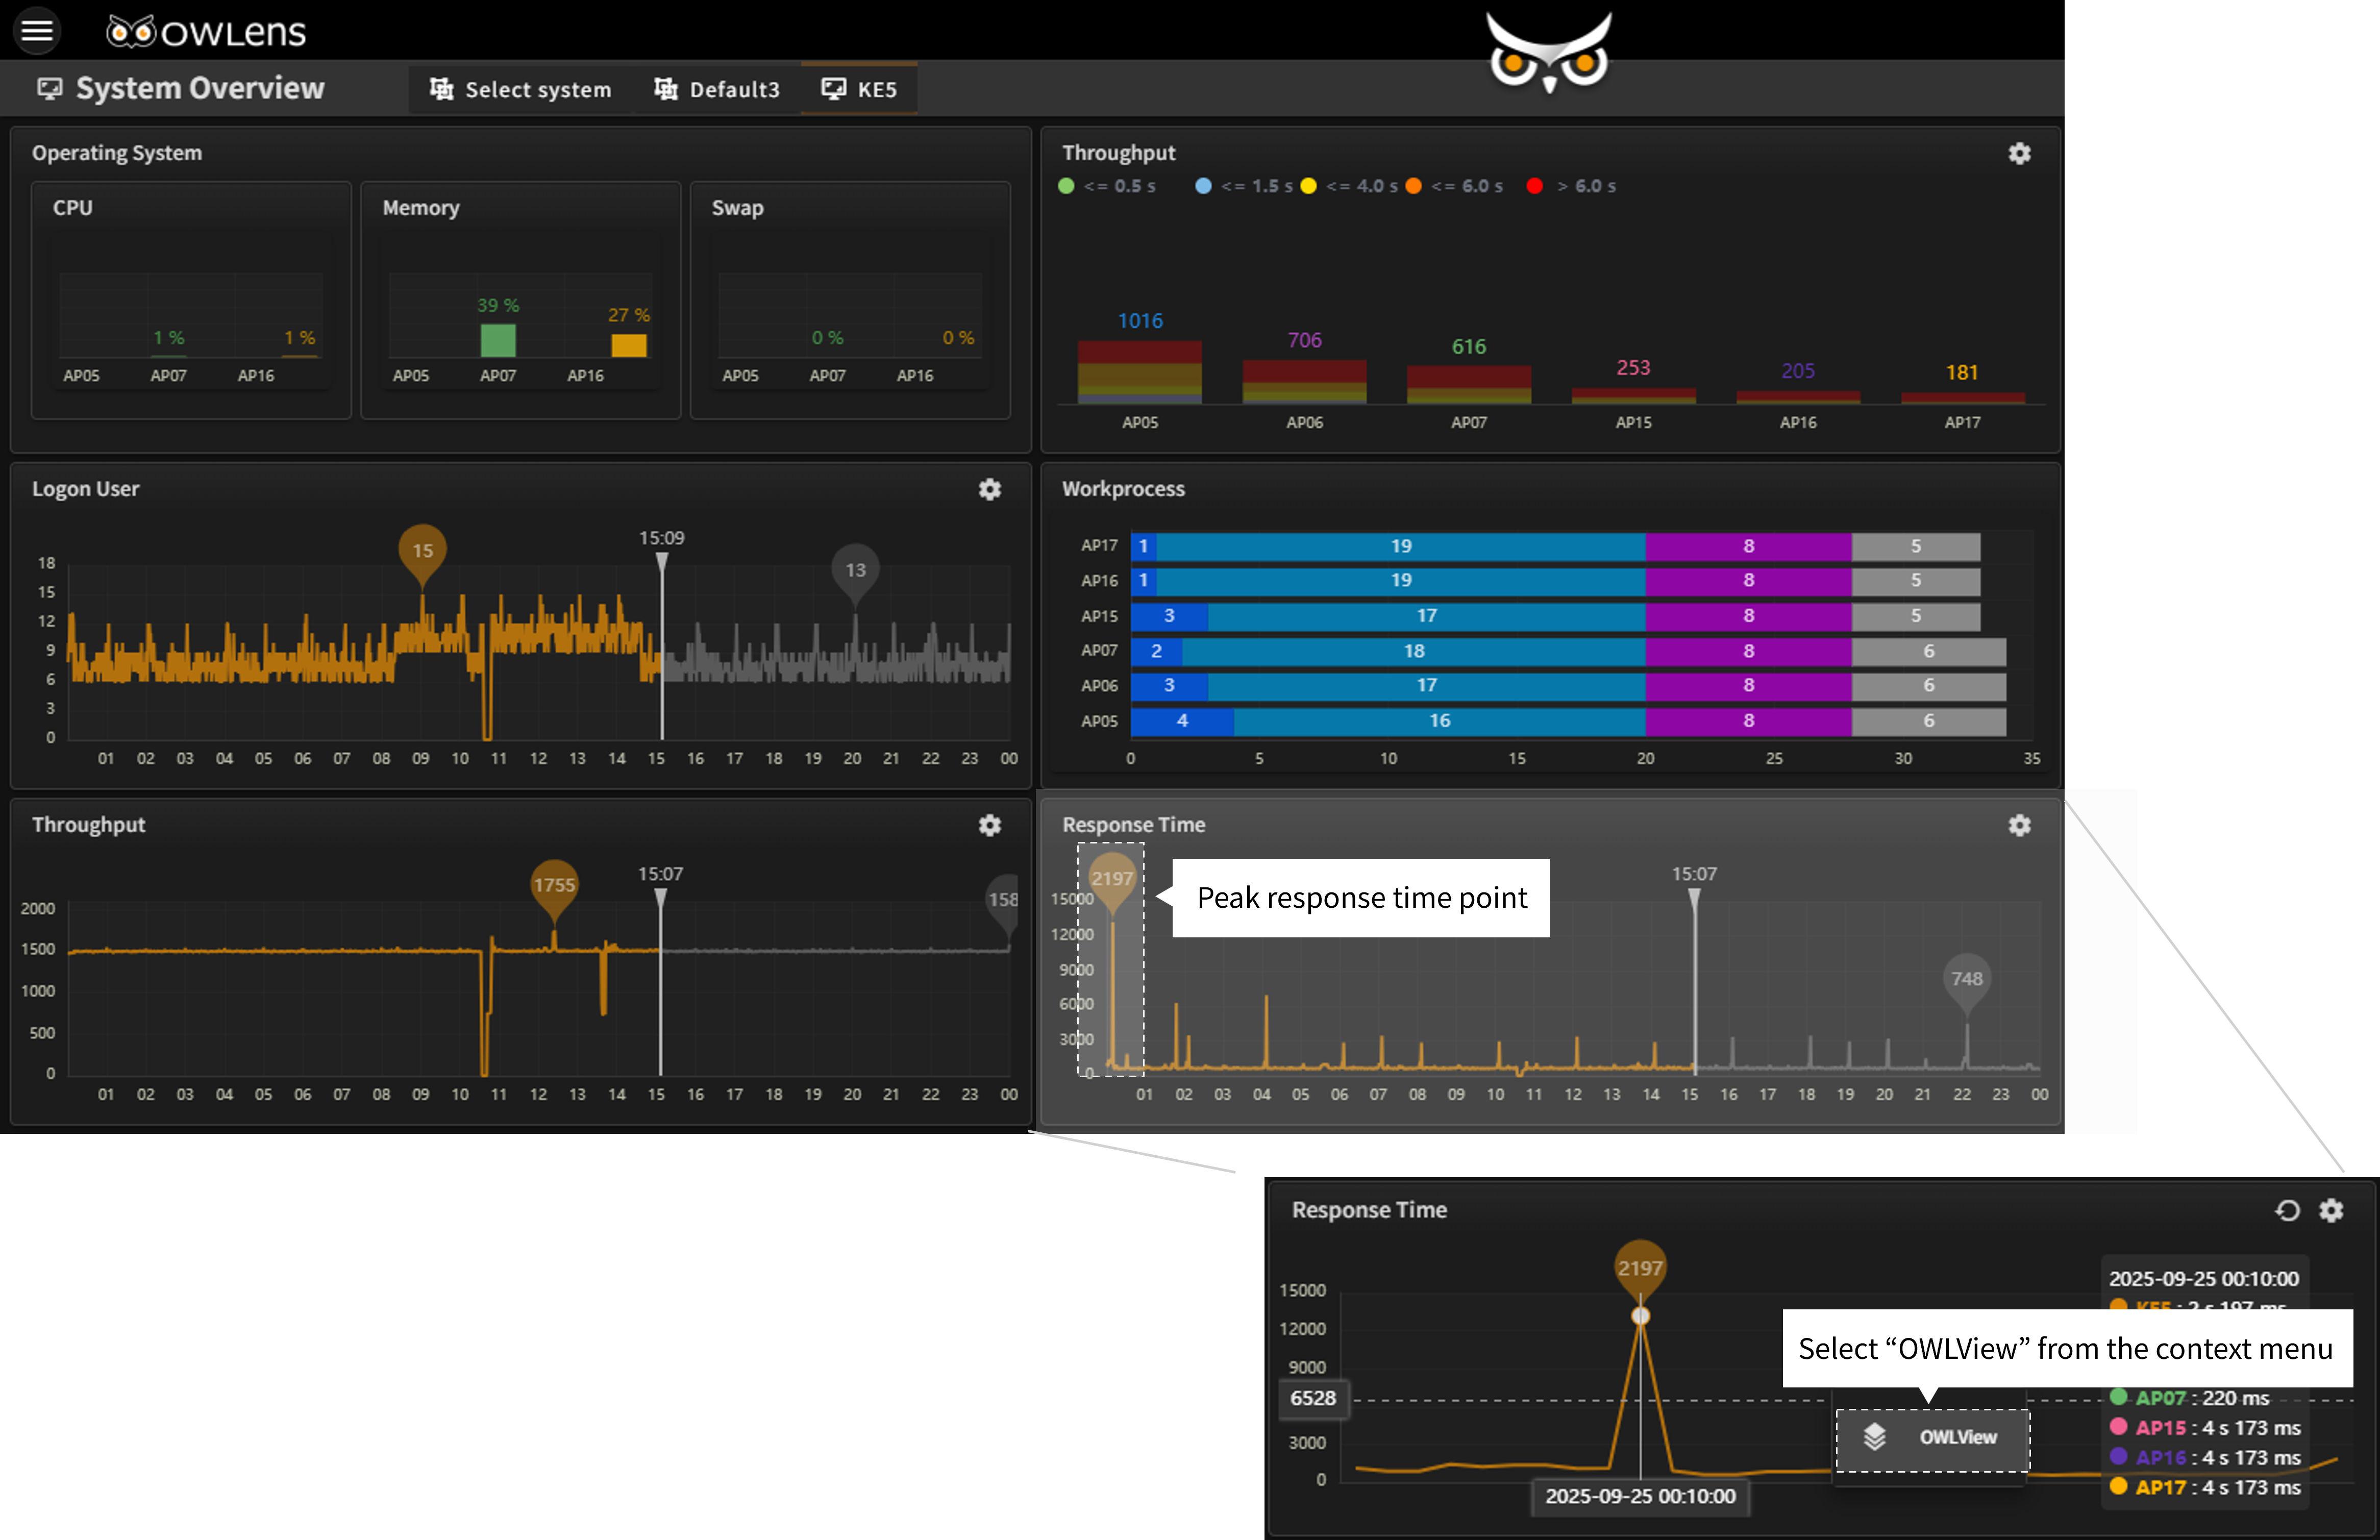
OWLens provides a comprehensive real-time monitoring dashboard that integrates key SAP system performance metrics into a single view.
The dashboard displays:.
24-hour charts of active users (and session counts),Throughput (business transactions per unit time), and average response time.
It also provides detailed system load indicators such as:.
CPU/Memory/Swap usage of the operating system, Work process status by type, Central instance metrics (e.g., number of ABAP dumps, Enqueue/Exclusive locks, Update records),Extended memory usage for each instance..
Additionally, intuitive visual tools such as the Equalizer Chart and OWLView Chart help you quickly assess system load conditions at a glance..
The System Overview feature is accessible via:.
Main Menu → Real-Time Dashboard → Overview → System Overview.
- On the System Overview screen, you can identify periods of degraded performance by reviewing the Response Time All Day chart, where spikes in response time become clearly visible.(Alternatively, you can use the Throughput All Day chart to detect periods with abnormally high transaction volume.)
- You can zoom in on a specific time range in the chart by dragging your mouse over it. After zooming in, move your cursor to the exact time of interest, right-click, and select “OWLView” from the Context Menu. This opens the OWLView screen in a separate browser window.
- In the OWLView screen, you’ll see a list of programs that were executed at the selected point in time, sorted by longest response time first. You can identify which user executed which program on which SAP instance, and view detailed breakdowns of response time for each execution.
- The response time is broken down by various components such as:Dispatch wait time, User context switch time, Program load time, Business logic execution time, DBMS request time, Enqueue lock wait time, and screen switching or RFC wait time.
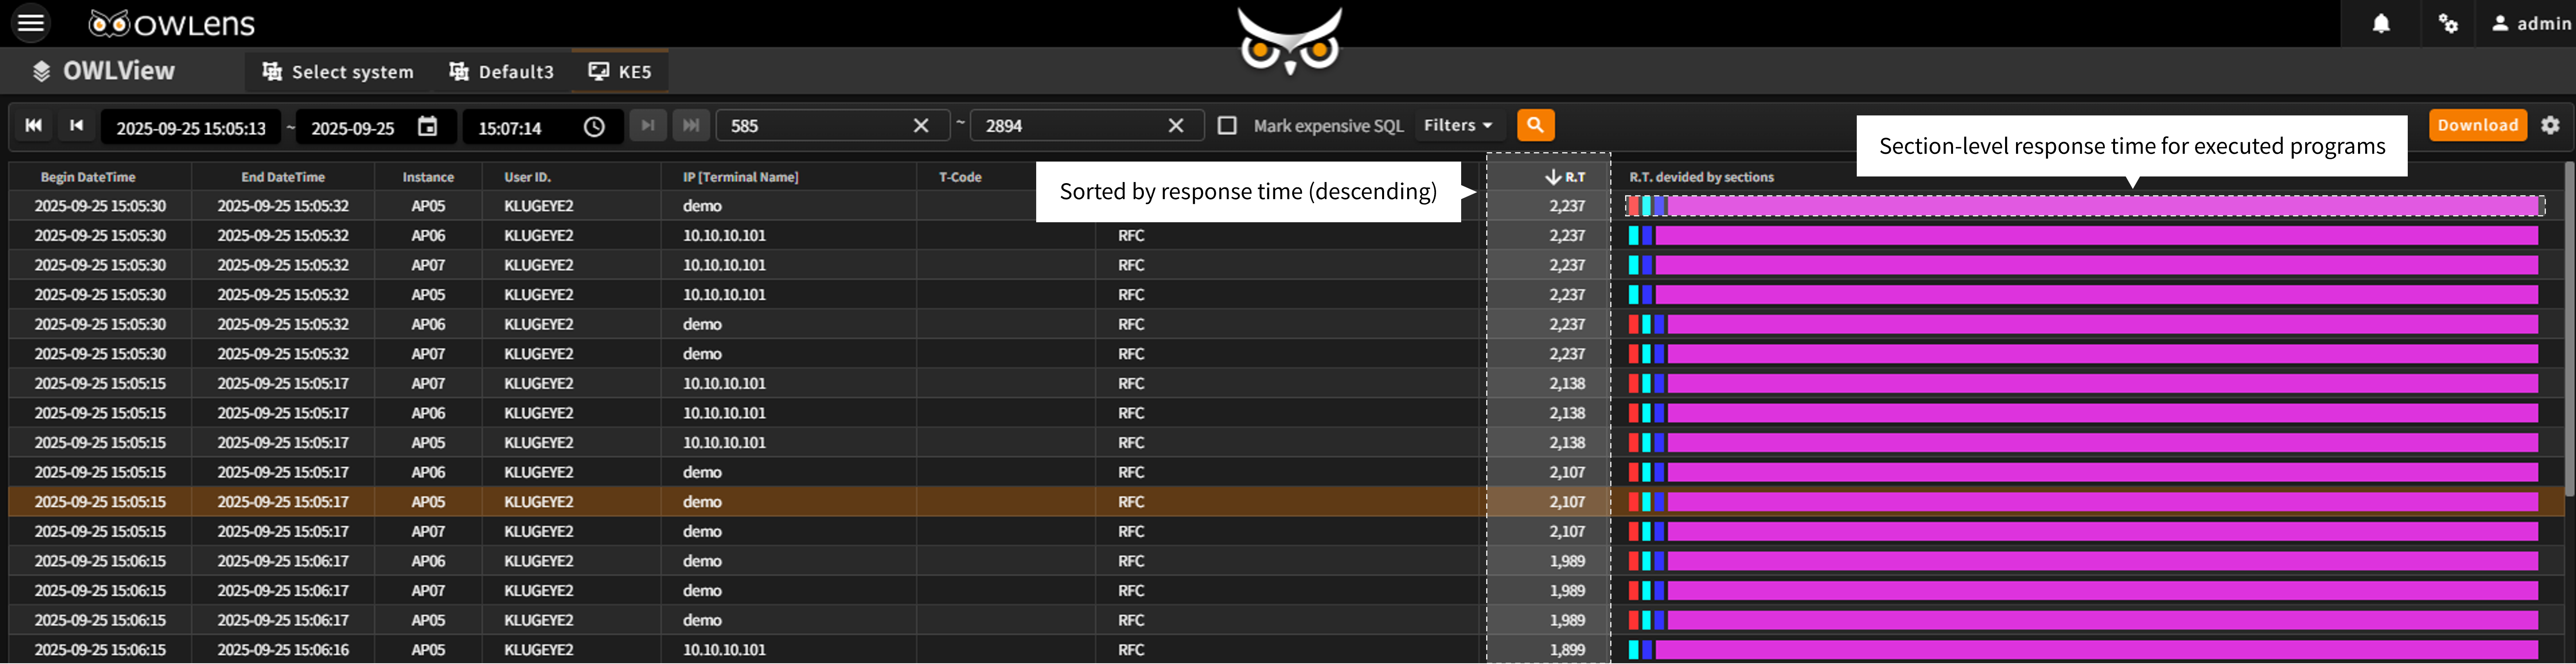
- Quickly analyze the root cause of system load at specific points in time.
- Export program execution history to Excel for operational reporting and analysis.